How much inventory is on the Austin housing market right now?
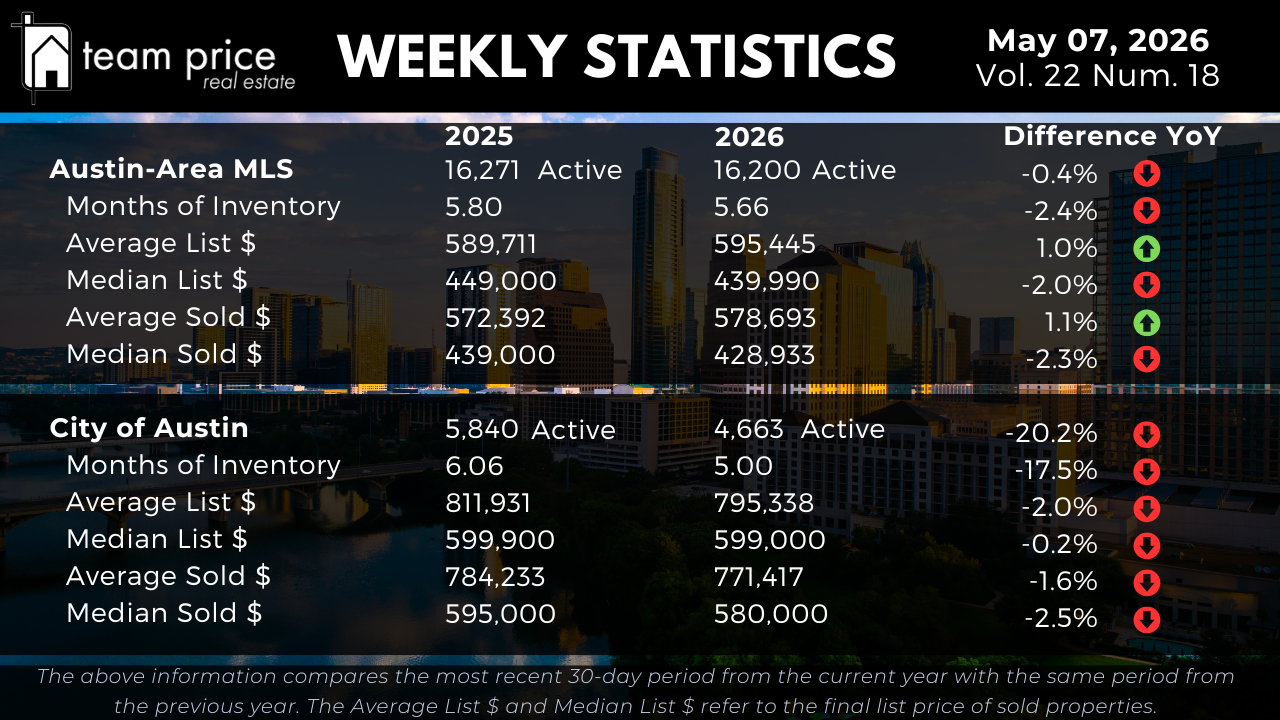
The Austin-Area MLS shows 16,200 active listings this week, down 0.4 percent from 16,271 a year ago. Months of inventory regionally sits at 5.66, slightly improved from 5.80 last year. On a Greater Austin basis, supply is steady, selection is wide, and the regional balance has not meaningfully shifted in twelve months.
The City of Austin is moving on a different track. Active listings inside the city limits have fallen to 4,663, down 20.2 percent from 5,840 one year ago. Months of inventory in the city dropped from 6.06 to 5.00, a 17.5 percent compression. Just one week ago, City of Austin inventory was down 13.5 percent year over year. The acceleration from -13.5 percent to -20.2 percent in seven days is the most distinctive shift in this week's Greater Austin MLS data and a clear signal that the urban core is absorbing supply faster than the surrounding region.
What are Austin home prices doing in May 2026?
The average list price for active homes across the Austin-Area MLS is $595,445, up 1.0 percent year over year. The average sold price this month is $578,693, up 1.1 percent. The medians soften the picture. Median list price is $439,990, down 2.0 percent year over year, and median sold price is $428,933, down 2.3 percent. The split between rising averages and falling medians shows a market where higher-end activity is lifting the top while the broader middle is recalibrating.
How do City of Austin home prices compare?
Inside the City of Austin, the average active list price is $795,338, down 2.0 percent year over year. Median active list price is $599,000, virtually flat at down 0.2 percent. Average sold price is $771,417, down 1.6 percent, and median sold price is $580,000, down 2.5 percent from $595,000 last year. Every City of Austin price metric is below where it stood twelve months ago, even as inventory inside the city has tightened sharply. That combination, falling supply and softer pricing, tells you the city is in transition. The supply side has moved first. Pricing typically follows.
Where is the Austin TX homes for sale market giving buyers leverage, and where is competition rising?
The average sold-to-list price ratio across the Austin-Area MLS sits at 98.1 percent, meaning sellers are still collecting close to ask on average. Underneath that average, the offer dynamics are shifting. So far this month, 61.92 percent of properties sold under list price, slightly improved from 62.07 percent last month. The share selling at list price dipped to 21.24 percent from 22.58 percent. The most telling shift is at the top of the offer stack. Homes selling over list price climbed to 16.84 percent this month, up from 15.35 percent last month and up from 14.93 percent in May 2025. Buyer leverage is still real across most of the market, but competitive bidding is quietly returning on the most desirable Travis County real estate.
Which Austin cities and ZIP codes are leading and lagging right now?
Across the 30 cities tracked in the Greater Austin MLS, 13 posted a month over month price increase and 13 posted a month over month decrease, a perfectly split 43 percent to 43 percent. Year over year, 12 of 30 cities are up in price and 18 are down, a 40 to 60 split. From peak in the past twelve months, only 3 of 30 cities are higher and 27 are lower.
Across the 75 Central Texas ZIP codes tracked, 33 posted a month over month price increase and 37 posted a decrease, a 44 to 49 split. Year over year, 32 ZIP codes are up and 43 are down. From peak, only 5 of 75 ZIP codes are higher and 70 are below their twelve-month high. The complete city-by-city and ZIP-by-ZIP breakdown, including average and median sold price, days on market, and inventory for each area, is available in the downloadable PDF report linked at the top of this page.
How far is the Austin housing market from peak?
In the Austin-Area MLS, the average list price peaked at $708,929 in March 2023 and now sits at $674,140, down 4.9 percent. The median list price peaked at $539,900 in May 2022 and is now $440,000, down 18.5 percent. The average sold price peaked at $664,515 in May 2022 and is now $619,380, down 6.8 percent, while the median sold price peaked at $538,000 in May 2022 and is now $450,000, down 16.4 percent. On a per-square-foot basis, the average sold price has moved from a peak of $324 in April 2022 to $269 today, down 17.0 percent, and the median sold price per foot has moved from $280 to $223, down 20.4 percent.
The City of Austin shows a similar pattern with one notable difference. The average list price peaked at $957,511 in September 2025, just eight months ago, and now sits at $881,881, down 7.9 percent. That recent peak month, much closer than the broader MLS, shows that City of Austin listing prices were still climbing into late 2025 before this current pullback. The median list price peaked at $658,589 in May 2022 and is now $574,000, down 12.8 percent. The average sold price peaked at $847,583 in May 2022 and is now $791,876, down 6.6 percent, while the median sold price peaked at $680,000 in May 2022 and is now $591,800, down 13.0 percent. On a per-square-foot basis, the City of Austin average sold price has moved from $442 to $362, down 18.1 percent, and the median sold price per foot has moved from $393 to $320, down 18.6 percent.
What is the Austin real estate market outlook heading into late spring 2026?
The signal this week is divergence with momentum. The Austin-Area MLS is holding steady on supply, with selection wide and pricing disciplined. The City of Austin is tightening on supply at an accelerating pace and seeing softer pricing at the same time, a setup that historically precedes firmer values once the inventory drawdown stabilizes. Across the region, the rising share of homes selling over list price suggests buyer competition is quietly building at the top of the market even as most homes still trade under ask. For buyers, the window of selection and negotiation room is real but is no longer expanding. For sellers, pricing to current comparable sold figures, not last cycle's peak, remains the only reliable path to a clean transaction.