Austin Housing Market Update: Months of Inventory Drops Year-Over-Year for the First Time Since 2021
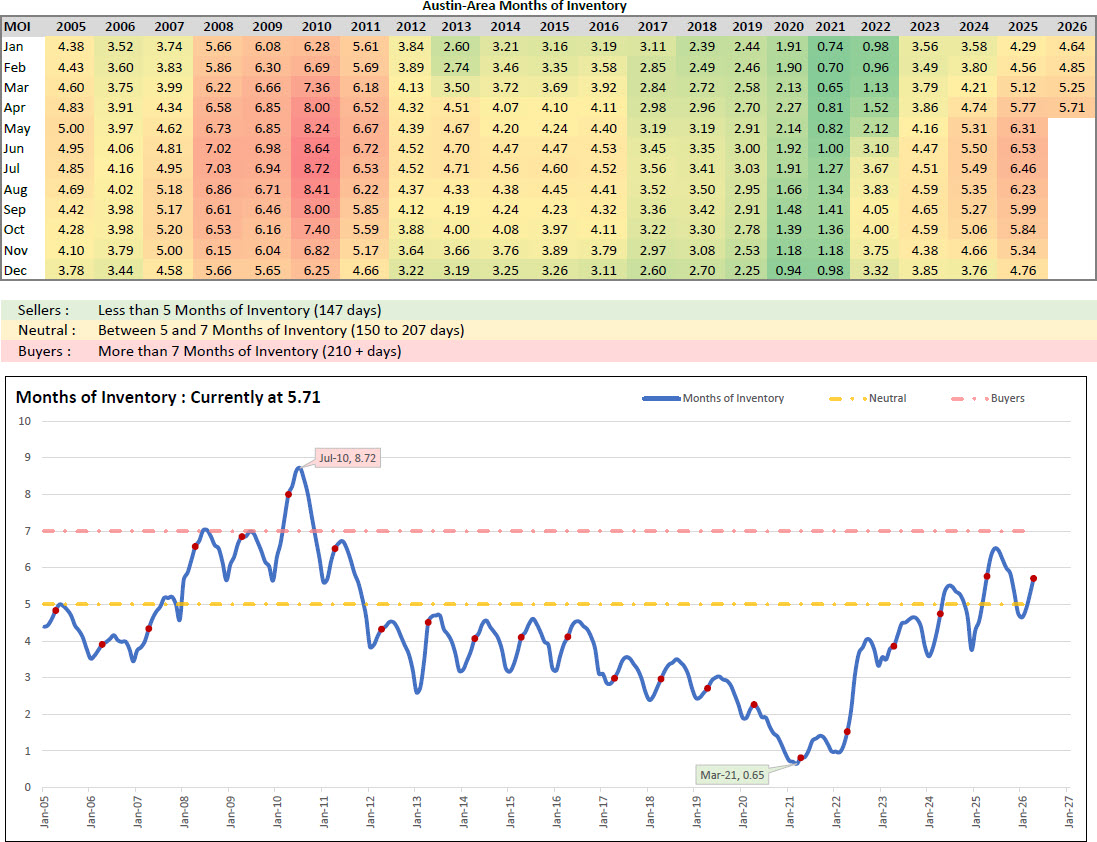
After 54 straight months of year-over-year increases, the Austin housing market just flipped a switch that hasn’t moved since the height of the pandemic frenzy. Months of Inventory in the Austin metro fell to 5.71 in April 2026, down from 5.77 in April 2025. The decline is small in absolute terms, just 0.06 months, but the direction is what matters. This is the first April-to-April decrease in supply since October 2021, and it suggests the long inventory build that defined the post-COVID Austin real estate market may finally be losing momentum.
For a market that spent four-plus years drifting toward buyer-friendly conditions, even a modest YoY contraction in supply is a meaningful signal. The Austin real estate forecast has hinged on whether inventory would keep climbing or stabilize. The April 2026 reading is the clearest evidence yet that stabilization, not further erosion, is becoming the base case.
What Months of Inventory Actually Measures
Months of Inventory, often abbreviated as MOI, measures how long it would take to sell every active listing in a given market at the current pace of sales. It is the most widely used supply-and-demand benchmark in residential real estate because it captures both sides of the equation in a single number. A reading of 5.71 means that, at April 2026’s sales pace, it would take roughly 5.7 months to clear every home currently for sale across the Austin metro.
The Austin Area MLS uses three thresholds to classify market conditions. Less than 5 months of inventory, equivalent to 147 days, defines a seller’s market. Between 5 and 7 months, or 150 to 207 days, defines a neutral market. More than 7 months, or 210 days and beyond, defines a buyer’s market. At 5.71 months, the Austin metro sits firmly in neutral territory, but it is now drifting back toward the seller’s side of that band rather than away from it.
The 54-Month Streak That Just Ended
To appreciate how unusual the April 2026 reading is, it helps to understand what came before it. The last time Austin metro MOI posted a year-over-year decline was October 2021, when the figure dipped to 1.36 from 1.39 a year earlier. That was during the most extreme seller’s market in modern Austin housing history, when supply was so scarce that homes routinely sold within days. From that point forward, every single month, October 2021 through March 2026, recorded a higher MOI than the same month one year earlier. That is 54 consecutive months of YoY supply expansion.
The streak captured the entire correction phase of the Austin property market. Inventory bottomed at 0.65 months in March 2021, then climbed steadily as mortgage rates rose, affordability deteriorated, and the speculative buyer pool thinned out. By June 2025, MOI had reached 6.53, the highest summer reading the metro had seen since 2011. The April 2026 break in the streak does not undo any of that buildup, but it is the first crack in what had become a one-direction trend.
April 2026 in Historical Context
Austin housing trends in April have varied dramatically across the past two decades. April 2010 marked the cyclical peak at 8.00 months of inventory, part of the broader 2010 supply surge that culminated in the all-time high of 8.72 months that July. April readings then trended steadily lower through the 2010s, reaching a low of 0.65 in April 2021 at the apex of the pandemic-era seller’s market. The April 2026 figure of 5.71 sits well above the post-2012 average for the month but well below the 2010-2011 buyer’s market peaks.
Compared to April 2025’s reading of 5.77, the new figure represents a year-over-year decline of about 1 percent. That is a modest move, and the Austin housing market still carries significantly more supply than it did during the 2017 to 2022 stretch when April readings ranged from 1.52 to 2.96. But the directional change matters because momentum in MOI tends to persist. Once the YoY trend flips, it often stays flipped for an extended period before reversing again.
Seasonal Patterns vs. Year-Over-Year Trends
It is worth separating two different signals embedded in the data. Within 2026 alone, MOI has risen from 4.64 in January to 4.85 in February, 5.25 in March, and 5.71 in April. That month-over-month build is normal seasonal behavior. Spring brings a wave of new listings as sellers prepare for the peak buying months, and inventory typically expands faster than sales early in the season before sales catch up later in the summer. Every recent year shows the same January-to-April climb.
The year-over-year comparison strips out that seasonality. Comparing April to April removes the predictable spring buildup and isolates the underlying supply-demand balance. On that basis, April 2026 is tighter than April 2025, which means buyer absorption improved enough to outpace listing growth on a same-month basis for the first time in nearly four and a half years. That is the headline shift in this Austin housing market update.
What This Means for the Austin Real Estate Forecast
A single month of YoY decline does not redefine the market, and Austin home prices remain sensitive to mortgage rates, employment trends, and migration patterns. But the April 2026 reading does undermine the narrative that supply is on a one-way path higher. If May, June, and July 2026 follow the same pattern, with each month coming in below its 2025 comparable, the Austin real estate market would shift from a softening trajectory to a stabilizing or even tightening one. That would have direct implications for pricing power, days on market, and seller leverage in negotiations.
For sellers, the data suggests competitive pressure may have peaked in mid-2025, when MOI hit 6.53 in June. For buyers, it suggests the window of maximum negotiating leverage may already be closing, even though the metro remains in neutral territory at 5.71 months. The Austin real estate trends to watch in the coming months are whether this YoY decline is a one-off statistical blip or the start of a sustained reversal. The historical pattern, after long runs of YoY expansion, favors the latter.
The Bigger Picture for the Austin Property Market
Stepping back, the Austin metro has now spent roughly 22 months in the neutral 5-to-7 MOI band, with brief excursions toward the buyer’s side in mid-2025. That is the longest stretch of neutral-market conditions since the 2014-2015 transition out of the post-recession recovery. Markets that spend extended periods in neutral territory tend to develop more predictable price behavior, with appreciation rates closer to long-term averages rather than the boom-and-bust swings of 2020-2022.
The April 2026 data point fits that broader picture. Rather than tipping the market into buyer territory, supply has pulled back slightly while remaining in the neutral band. For the first time in this Austin housing market update cycle, the most recent data is consistent with a market finding equilibrium rather than continuing to drift. Whether that holds through the remainder of 2026 will depend on listing volume, sales velocity, and the broader interest rate environment, but the April reading is the strongest evidence yet that the post-pandemic correction in Austin real estate may be winding down.
Frequently Asked Questions
What does Months of Inventory mean in the Austin housing market?
Months of Inventory measures how long it would take to sell every active listing at the current sales pace. In the Austin housing market, the Austin Area MLS classifies less than 5 months as a seller’s market, 5 to 7 months as neutral, and more than 7 months as a buyer’s market. April 2026’s reading of 5.71 places the Austin metro in neutral territory. The metric is widely used because it captures both supply and demand in a single number, making it easier to compare conditions across months and years.
Is Austin still a buyer’s market in 2026?
No, the Austin real estate market is not currently a buyer’s market based on Months of Inventory. At 5.71 months in April 2026, the metro sits in the neutral band defined as 5 to 7 months of inventory. The market briefly approached buyer territory in mid-2025 when MOI peaked at 6.53 in June, but it has since pulled back. Conditions vary by price tier and submarket, but at the metro level, neither buyers nor sellers have a clear structural advantage right now.
When was the last time Austin Months of Inventory dropped year-over-year?
The last year-over-year decline before April 2026 was in October 2021, when MOI registered 1.36 versus 1.39 in October 2020. That makes April 2026 the first YoY decline in 54 months, ending a streak that ran from November 2021 through March 2026. During that entire stretch, every single month showed higher inventory than the same month one year earlier, reflecting the long correction from the pandemic-era supply lows.
What is the highest Months of Inventory the Austin metro has ever recorded?
The highest Months of Inventory reading in the Austin Area MLS data series occurred in July 2010, when MOI reached 8.72 months. That figure came during the broader post-recession housing correction and reflected very weak buyer demand combined with elevated listing volumes. By comparison, the lowest reading on record was 0.65 in March 2021, at the peak of the pandemic-driven seller’s market. The April 2026 reading of 5.71 sits roughly in the middle of that historical range.
Does a year-over-year drop in inventory mean Austin home prices will rise?
Not automatically, but it tightens the supply side of the equation that influences pricing. A YoY decline in Months of Inventory means buyer absorption is outpacing listing growth on a same-month basis, which historically supports firmer Austin home prices. However, the Austin real estate forecast also depends on mortgage rates, wage growth, employment, and migration trends, all of which influence buyer demand. A single month of YoY decline is a directional signal, not a guarantee of price appreciation, and the relationship between inventory and prices typically plays out over several quarters rather than instantly.