Austin's Two-Speed Housing Market: Why Ultra-Luxury Is Booming While 48 ZIPs Decline
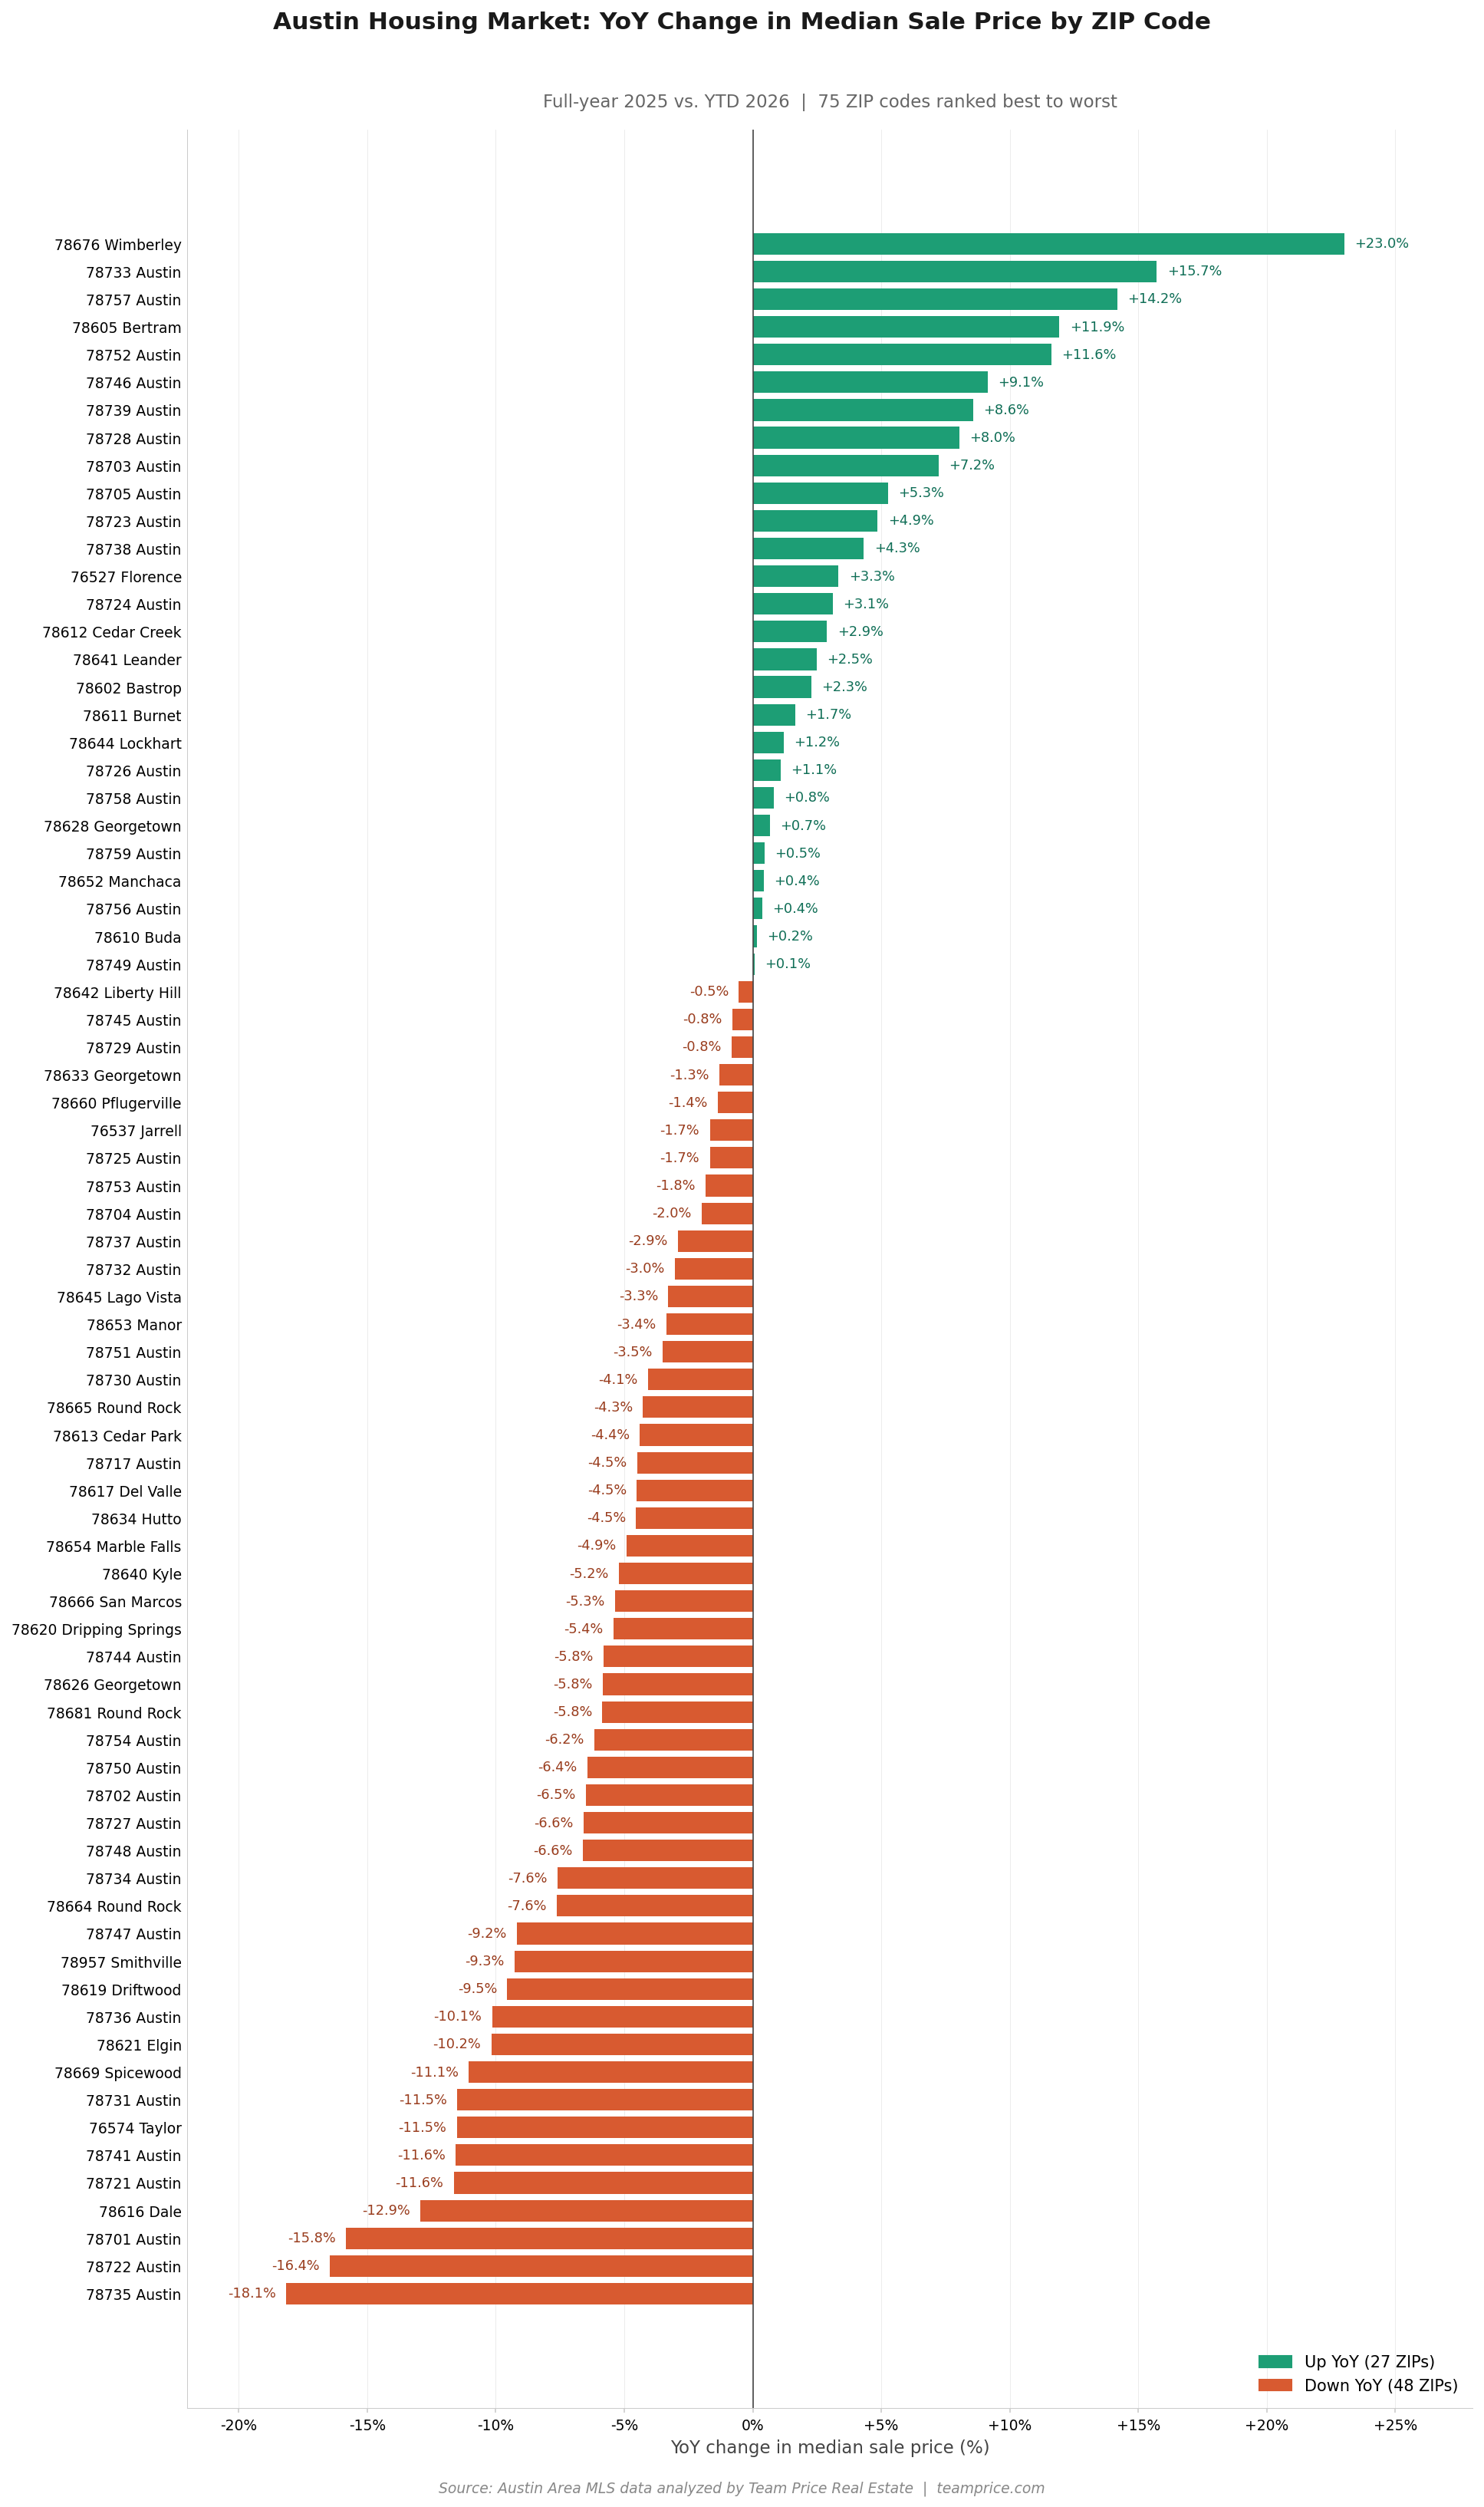
Austin's housing market has split in two. While 48 of 75 ZIP codes across the metro posted year-over-year median price declines from full-year 2025 into year-to-date 2026, the ultra-luxury tier — homes priced above $1.5 million — has emerged as the only segment posting positive average gains. The contrast tells a story that contradicts almost every headline written about Austin real estate over the past two years.
The numbers are stark. Across the 75 ZIP codes tracked in this analysis, the median year-over-year change is a decline of roughly 3 percent, and the average is down 2.2 percent. Yet within the four ZIP codes where the 2025 median sale price exceeded $1.5 million, three are up year-over-year, and the average gain across that tier is plus 3.5 percent. No other price tier comes close. Luxury homes between $1 million and $1.5 million are down nearly 6 percent on average. Mid-tier and entry-level ZIP codes are all in the red. This is not a uniform Austin housing market correction. It is a recovery concentrated almost entirely at the top.
The Wimberley Anomaly and the Westlake Surge
The single best-performing ZIP code in the entire Austin housing market analysis is 78676 Wimberley, where the median sale price climbed from $673,439 in 2025 to $828,459 year-to-date in 2026. That is a 23 percent gain — and importantly, it represents a new cycle high for the area, surpassing any previous peak. Wimberley sits roughly 40 miles southwest of downtown Austin and historically trades on Hill Country lifestyle premiums rather than employment-driven demand. The fact that it leads the metro in 2026 suggests buyers with discretionary capital are pricing the market very differently than buyers who depend on financing and proximity to the urban core.
The second story is 78746, the ZIP code anchoring Westlake and West Lake Hills. The median sale price rose from $2,193,816 in 2025 to $2,394,287 in YTD 2026, a 9.1 percent year-over-year increase. With Westlake already commanding the highest median price in the entire region, a $200,000 jump on top of an already-elevated base is significant. Westlake, like Wimberley, has effectively returned to or surpassed its prior cycle peak — making these two ZIP codes the only ones in the metro that have fully recovered from the 2022 correction.
The pattern continues at 78733, covering Bee Cave, Steiner Ranch, and the western Lake Austin corridor. The median there rose from $1,595,322 to $1,846,023 — a 15.7 percent gain and a $250,000 year-over-year increase in raw dollars. That is the largest absolute dollar increase of any ZIP code in this analysis, exceeding even Westlake's gain.
Where the Austin Real Estate Market Is Falling Hardest
At the other end of the spectrum, the steepest declines are concentrated in two very different submarkets: aspirational luxury and central-urban Austin.
The largest year-over-year median price decline in the dataset is 78735, the Barton Creek and southwest Austin ZIP code, where the median fell from $1,523,290 to $1,246,905 — a drop of 18.1 percent and $276,385 in absolute terms. This is the largest dollar decline of any ZIP code in the metro and signals real weakness in the upper-mid-luxury tier, which has not benefited from the same flight-to-quality dynamic lifting Westlake and Bee Cave.
Downtown Austin, ZIP code 78701, saw the median fall from $1,031,268 to $867,996, a decline of 15.8 percent. The condo-heavy downtown market continues to face structural pressure from elevated inventory, weaker post-pandemic demand for high-density urban living, and ongoing competition from new construction. East Austin's 78722 — historically one of the hottest gentrification corridors during the 2020 to 2022 boom — fell 16.4 percent, with the median dropping from $661,473 to $552,693. Together, these three declines tell a consistent story about which corners of the Austin real estate market the upper-tier recovery has not reached.
The pattern extends into the suburbs and exurbs. Spicewood (78669) is down 11.1 percent. Taylor (76574) is down 11.5 percent. Driftwood (78619) is down 9.5 percent. Marble Falls (78654) is down 4.9 percent. The Austin housing market correction is most visible in commuter-dependent and second-home submarkets where buyers are most sensitive to mortgage rates and economic uncertainty.
What the Tier Analysis Reveals About Austin Home Prices
Breaking the 75 ZIP codes into price tiers based on 2025 median sale price clarifies the divergence. The four ultra-luxury ZIP codes — those with 2025 medians above $1.5 million — averaged a 3.5 percent year-over-year gain, with three of four showing positive movement. The seven luxury ZIP codes between $1 million and $1.5 million averaged a 6 percent decline, with only one showing gains. The 11 upper-tier ZIP codes between $700,000 and $1 million averaged a 2.1 percent decline. The 17 mid-tier ZIP codes between $500,000 and $700,000 averaged a 1.4 percent decline. The 18 entry-level ZIP codes between $400,000 and $500,000 averaged a 2.2 percent decline. And the 18 most affordable ZIP codes — those below $400,000 — averaged a 2.8 percent decline.
The implication is unambiguous: as you move down the price ladder, performance worsens. The most expensive homes are appreciating. The most affordable homes are depreciating. Every tier in between is somewhere between flat and weak. This inverts the usual housing recovery narrative, where affordability tends to lead and luxury lags.
Why This Pattern Is Showing Up Now
Several forces explain the divergence. Ultra-luxury buyers in Austin tend to pay cash or use loan-to-value ratios that are insensitive to mortgage rate movements. Mortgage rates that have devastated the entry-level and mid-tier markets simply do not factor into a $2.4 million Westlake transaction the same way. At the same time, Austin's high-net-worth buyer pool has continued to grow through tech-sector wealth concentration, in-migration of finance professionals, and the ongoing relocation of corporate headquarters and family offices to Texas.
Inventory dynamics reinforce the divergence. Ultra-luxury inventory in Westlake, Bee Cave, and Wimberley remains constrained because new construction at those price points and locations is limited by land availability and zoning. Meanwhile, the entry-level and mid-tier markets are absorbing significant new construction inventory across Manor, Hutto, Pflugerville, Kyle, and the Round Rock submarkets, and that supply is putting steady downward pressure on resale comps.
Several mid-priced ZIP codes have shown surprising resilience worth flagging. ZIP code 78757, covering Crestview and Brentwood in north-central Austin, posted a 14.2 percent year-over-year gain with the median rising from $807,898 to $922,443. ZIP code 78739, covering Circle C Ranch in southwest Austin, gained 8.6 percent. These are walkable, established neighborhoods with limited new construction competition, and their performance suggests that location quality is reasserting itself as a primary driver of Austin home prices in 2026.
Reading This Data Correctly
A note on methodology and interpretation. The 2025 figures represent full-year median sale prices, while the 2026 figures represent year-to-date medians. Because Austin's spring selling season tends to skew transaction volumes and prices upward in the first half of the year, the year-to-date 2026 figures may modestly overstate full-year 2026 outcomes once the slower second half is included. This means the gains shown in some ZIP codes may compress slightly by year-end, and the declines may deepen marginally. The directional story — luxury outperforming, broader market softening — is unlikely to change, but the magnitude could shift several percentage points either way.
It is also worth noting that several of the ZIP codes showing the most extreme moves are smaller submarkets where median prices can swing significantly on relatively few transactions. ZIP codes like 78605 Bertram, 78725 Austin, and 78616 Dale should be read with that caveat in mind. The core conclusions of this Austin real estate report are anchored in the larger, higher-volume ZIP codes where median price movements reflect genuine market conditions.
What This Means for the Austin Real Estate Forecast
For sellers, the data argues against treating "the Austin market" as a single entity. A seller in Westlake or Wimberley is operating in a fundamentally different market than a seller in Pflugerville or Round Rock. Pricing strategy, days-on-market expectations, and concession willingness should all be calibrated to ZIP-level performance, not metro-wide averages.
For buyers, the divergence creates opportunity. ZIP codes like 78735, 78731, and 78701 are seeing the deepest discounts from peak in established, high-amenity Austin neighborhoods. For buyers with the capital and time horizon to absorb continued near-term softness, these are the corners of the market where Austin home prices have moved most. For investors, the relative strength of mid-density, walkable, established neighborhoods like 78757 and 78739 suggests where the next leg of recovery may begin.
The Austin housing market in 2026 is not in correction and it is not in recovery. It is in two markets at once — and which one a buyer or seller is operating in depends almost entirely on the ZIP code on the deed.
Frequently Asked Questions
Is the Austin real estate market going up or down in 2026?
The Austin real estate market in 2026 is moving in two directions at once. Across 75 ZIP codes analyzed, 48 are down year-over-year and 27 are up, with the median ZIP showing roughly a 3 percent decline. However, the ultra-luxury tier above $1.5 million is the only price segment posting positive average gains, with three of four ZIP codes up. So whether Austin home prices are rising or falling depends almost entirely on which ZIP code and price tier you're looking at — there is no single metro-wide direction.
Which Austin ZIP codes have the highest home prices in 2026?
The highest-priced Austin ZIP code in 2026 is 78746, covering Westlake and West Lake Hills, with a year-to-date median sale price of $2,394,287. Following Westlake are 78733 (Bee Cave/Steiner Ranch) at $1,846,023, 78703 (Tarrytown/Old West Austin) at $1,622,781, and 78735 (Barton Creek) at $1,246,905. These four ZIP codes anchor the ultra-luxury and luxury tiers of the Austin housing market and represent the segment that has performed best in the current cycle.
Where have Austin home prices fallen the most from peak?
While exact peak dates vary by ZIP code, the steepest year-over-year median price declines from 2025 to YTD 2026 occurred in 78735 (Barton Creek) at minus 18.1 percent, 78722 (East Austin) at minus 16.4 percent, and 78701 (Downtown Austin) at minus 15.8 percent. Several other ZIP codes including 78731 (Northwest Hills), 78741 (East Riverside), and 78721 (East Austin) are all down more than 11 percent year-over-year. These declines reflect concentrated weakness in central-urban condo markets and aspirational-luxury submarkets that have not benefited from the high-end recovery.
Why is the Austin luxury housing market outperforming the rest of the metro?
The Austin luxury housing market is outperforming because ultra-luxury buyers are largely insulated from the mortgage rate pressures crushing the entry-level and mid-tier markets. Many transactions above $1.5 million are completed with cash or low loan-to-value financing, making interest rate movements largely irrelevant. Combined with continued in-migration of high-net-worth buyers, expanding tech-sector wealth, and constrained new construction at the highest price points, the ultra-luxury tier has tighter inventory and stronger sustained demand than any other segment of the Austin real estate market.
What is the Austin real estate forecast for the rest of 2026?
The Austin real estate forecast for the remainder of 2026 depends heavily on price tier and submarket. Ultra-luxury ZIP codes like Westlake and Wimberley are likely to maintain their gains given limited inventory and resilient demand. Mid-tier and entry-level ZIP codes facing competition from new construction and rate-sensitive buyers are likely to see continued price softness through year-end. Because the 2026 figures are year-to-date and Austin typically sees seasonal price moderation in the second half, the year-over-year gains in some ZIP codes may compress modestly, while declines in weaker markets may deepen by several percentage points. The two-speed market structure is unlikely to reverse before 2027.