Austin Housing Affordability Hits Six-Year High: Price-to-Income Ratio Falls to 3.94 in April 2026
For the first time since the pandemic upended the Austin real estate market, affordability is staging a real comeback. The Austin metro's median sold price-to-income ratio fell to 3.94 in April 2026, the most affordable April reading the region has posted since April 2020, when the ratio sat at 3.91 just before the pandemic-era price surge began. After four consecutive years of severe affordability stress, the Austin housing market is finally moving back toward its long-term norm.
What the Price-to-Income Ratio Measures and Why It Matters
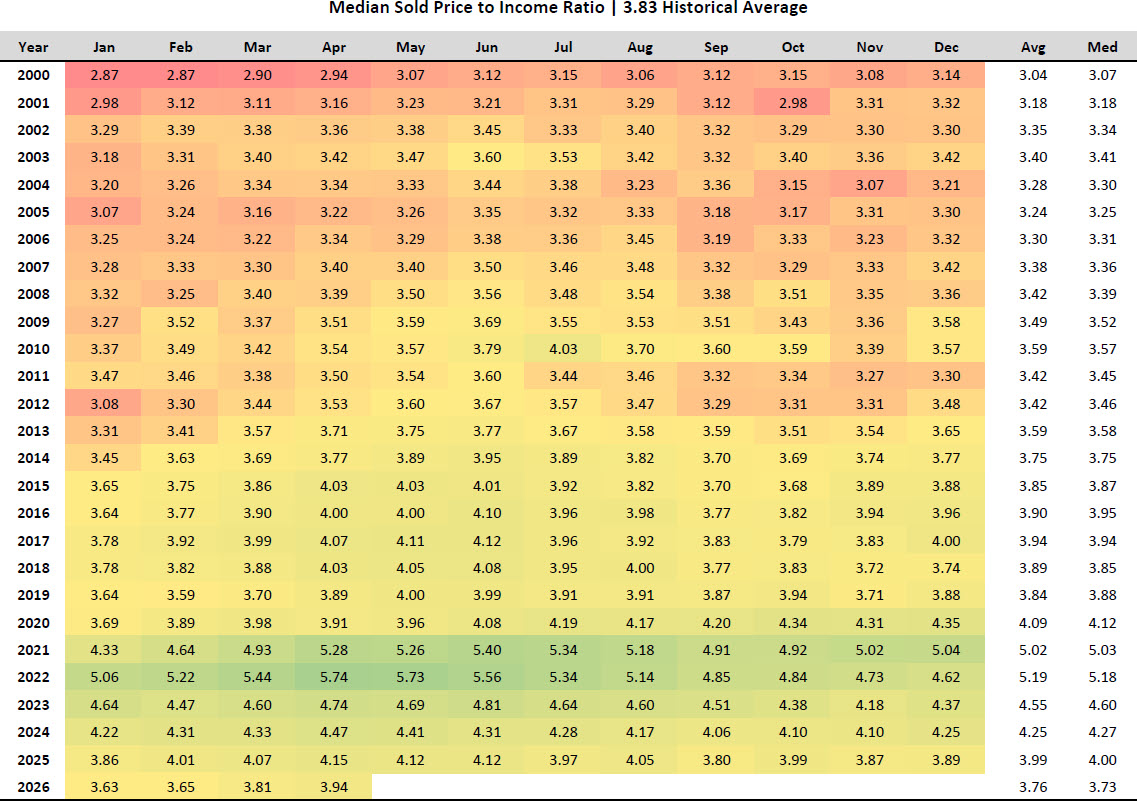
The price-to-income ratio is one of the most widely used affordability benchmarks in housing economics. It divides the median sold home price by the median household income for a given market. A ratio of 3.0 or below is generally considered affordable, ratios between 3.0 and 4.0 are considered moderately unaffordable, ratios between 4.0 and 5.0 are seriously unaffordable, and anything above 5.0 is classified as severely unaffordable under the framework popularized by the Demographia International Housing Affordability Survey. For the Austin metro, the long-term historical average sits at 3.83, meaning Austin has historically been a moderately affordable major metro by national standards. That context is important because it tells us where the market is supposed to settle when speculative pressure clears out.
When the ratio climbs, it signals that home prices are rising faster than incomes, squeezing buyers out of the market and forcing households to stretch further to buy. When the ratio falls, either prices are softening, incomes are rising, or both. What is happening in Austin right now is a combination of both forces working in the buyer's favor.
April 2026: The Most Affordable April in Six Years
At 3.94, the April 2026 reading is just 0.11 points above the long-term historical average of 3.83. To put that in perspective, the Austin metro has not posted an April reading this close to its historical norm since 2020. In April 2025 the ratio was 4.15, in April 2024 it was 4.47, in April 2023 it was 4.74, and in April 2022 it hit a record-shattering 5.74. The April 2026 figure represents a year-over-year improvement of roughly 5.1 percent in affordability, and a stunning 31.4 percent improvement from the April 2022 peak. This is one of the most dramatic affordability resets any major U.S. metro has experienced in modern housing data.
The peak itself deserves a closer look. April 2022 marked the height of pandemic-era price acceleration in the Austin housing market, when remote work migration, ultra-low mortgage rates, and a wave of investor activity collided to push the price-to-income ratio to 5.74, well into severely unaffordable territory. At that level, the typical Austin home cost nearly six times the typical household income. The market has spent four years unwinding that distortion, and April 2026 marks the clearest signal yet that the recovery in affordability is real and accelerating.
How Austin Got Here: A Four-Year Affordability Reset
Looking back at the historical data, the Austin metro spent the entirety of the 2000s and 2010s with annual average ratios between 3.04 and 3.94. The ratio never crossed 4.00 on an annual average basis until 2020, when it hit 4.09. Then 2021 brought a jump to 5.02, and 2022 reached 5.19, the highest annual average on record. The market began correcting in 2023 (annual average 4.55), continued lower in 2024 (4.25), and dropped to 3.99 in 2025. The 2026 average through April sits at 3.76, which if it held would be the most affordable annual reading the Austin metro has produced since 2019, when the average was 3.84.
This reset has been driven by two simultaneous forces. First, Austin home prices have been correcting from their 2022 peak, with months of inventory rising and sellers facing real negotiation pressure. Second, Austin metro household incomes have continued to grow, supported by the region's strong technology, healthcare, and professional services employment base. When prices soften and incomes rise at the same time, affordability improves twice as fast.
Is Austin Affordable Again? The Nuance Behind the Headline
The most important question for buyers and sellers is whether Austin is genuinely affordable now. The honest answer is that Austin is more affordable than it has been at any point in the past six years, but it is not yet at its long-term historical norm. At 3.94, the ratio is still 0.11 points above the 3.83 historical average and well above the sub-3.0 readings the metro produced in 2000 and 2001. However, the trajectory matters as much as the level. The ratio has fallen for four consecutive years from its 2022 peak, and the pace of improvement has been consistent.
For buyers, this means the Austin housing market is offering the best affordability conditions seen since the early pandemic period. For sellers, it means the price acceleration of 2021 and 2022 is firmly in the rearview mirror, and pricing strategy has to reflect a market where buyers have negotiating power and alternatives. For long-term observers of the Austin real estate market, the data suggests the metro is converging back toward its historical equilibrium rather than establishing a new permanently elevated baseline.
The 2026 Trajectory: Watching the Spring Pattern
There is one important nuance in the 2026 data worth flagging. The monthly readings have climbed steadily through the spring: 3.63 in January, 3.65 in February, 3.81 in March, and 3.94 in April. This is consistent with the seasonal pattern that has shown up in nearly every year of the historical dataset, where the ratio typically rises into the summer as spring buying season pushes median sold prices higher. Looking at the historical pattern, ratios in the Austin metro tend to peak between June and August before easing in the fall. So while April 2026 marks a six-year low for that specific month, the ratio could continue climbing through the summer before resuming its longer-term downward trend.
What buyers and sellers should watch for is whether the summer 2026 peak comes in below the summer 2025 peak. In 2025, the ratio peaked at 4.12 in May before declining. If summer 2026 peaks below that level, it would confirm the affordability recovery has structural momentum and is not just a winter seasonal artifact. Based on the year-to-date pace, that outcome looks likely.
What This Means for the Austin Real Estate Market
The Austin housing market update for April 2026 is one of the most significant affordability readings the metro has produced in years. The price-to-income ratio is a slow-moving, structural indicator that does not whip around month to month, which makes a six-year improvement particularly meaningful. Austin home prices are now in a more sustainable relationship with local incomes than they have been at any point since 2020, and the trajectory continues to favor buyers entering the market.
For anyone tracking Austin real estate trends, the takeaway is straightforward. The pandemic-era affordability crisis is resolving. The Austin property market is moving back toward historical norms. And buyers who were priced out during the 2021 and 2022 surge are finding that the math finally works again.
Frequently Asked Questions
Is Austin affordable in 2026?
Austin is more affordable in 2026 than it has been in six years, but it is still slightly above its long-term historical affordability norm. The April 2026 median sold price-to-income ratio of 3.94 is the lowest April reading since April 2020 and represents a 31.4 percent improvement from the April 2022 peak of 5.74. However, at 3.94 the ratio remains 0.11 points above the Austin metro's 3.83 historical average, placing the market in moderately unaffordable territory rather than fully affordable. The trajectory is clearly improving, with affordability gains for four consecutive years.
What is a healthy price-to-income ratio for housing?
In housing economics, a price-to-income ratio of 3.0 or below is considered affordable, 3.0 to 4.0 is moderately unaffordable, 4.0 to 5.0 is seriously unaffordable, and 5.0 or above is severely unaffordable. The Austin metro's long-term historical average is 3.83, which falls in the moderately unaffordable range but is consistent with most major U.S. metros. The current April 2026 reading of 3.94 places Austin near its historical norm and well below the severely unaffordable territory the market occupied from 2021 through 2023.
How much have Austin home prices dropped from the peak?
While the price-to-income ratio is not a pure price metric, it captures the combined effect of price changes and income growth. From the April 2022 peak ratio of 5.74 to the April 2026 reading of 3.94, the Austin metro has improved affordability by 31.4 percent. This reflects both meaningful price corrections from the 2022 highs and continued income growth across the Austin metro economy. The four-year reset is one of the most significant affordability recoveries any major U.S. housing market has produced in modern data.
Is now a good time to buy a home in Austin?
The April 2026 affordability data suggests that buyers are facing the most favorable price-to-income conditions in six years. The Austin real estate market has shifted meaningfully in favor of buyers compared to the 2021 and 2022 environment, with prices in a healthier relationship to local incomes. Whether any individual buyer should purchase depends on personal financial circumstances, mortgage rate environment, and long-term plans, but the structural affordability picture in the Austin housing market is the most attractive it has been since before the pandemic-era surge.
What is the Austin real estate forecast based on affordability trends?
The Austin real estate forecast based on affordability data points to continued normalization toward the metro's 3.83 historical average. The price-to-income ratio has declined for four consecutive years and is now within 3 percent of the long-term norm. If current trends hold through summer 2026, the Austin metro could post its first full-year average ratio below the historical average since 2019. This would mark the formal end of the pandemic-era affordability dislocation and signal a return to the housing fundamentals that defined the Austin market for two decades.