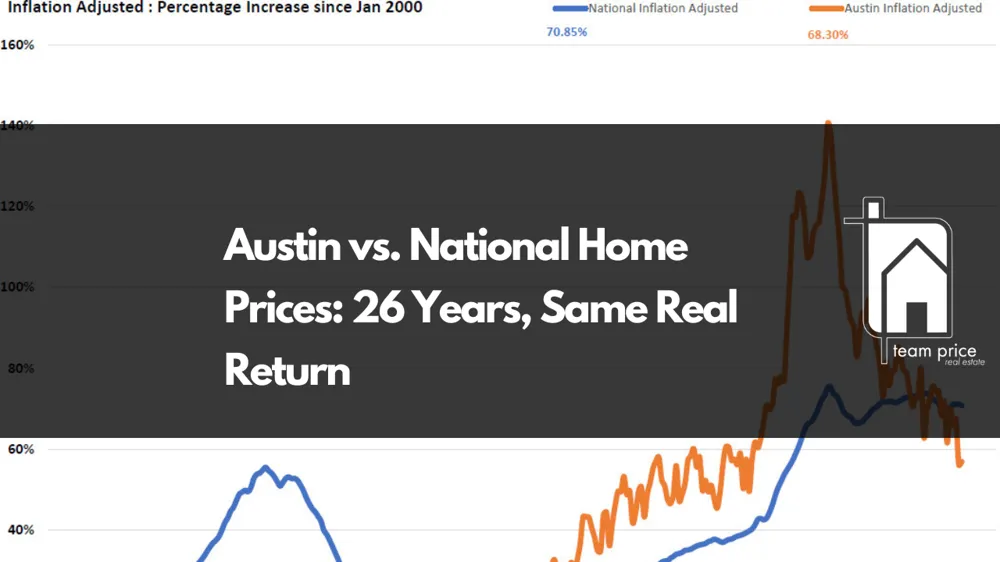
Austin vs. National Home Prices: 26 Years, Same Real Return, Wildly Different Paths
Look at a long enough chart and the noise disappears. The story shows up. The latest National Market Index data through February 2026 confirms something that almost nobody is talking about. After 26 years of booms, busts, surges, and corrections, Austin and the national housing market have landed in essentially the same place in real, inflation-adjusted terms.
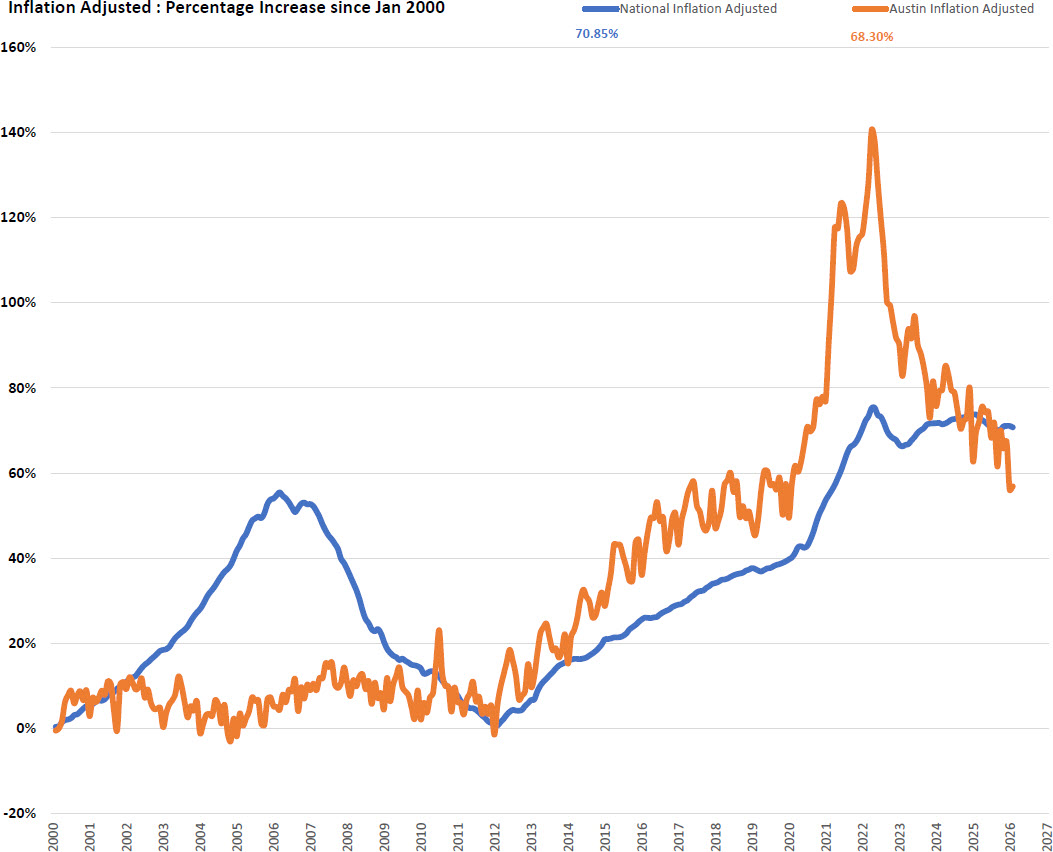
National home values are up 70.85 percent in real terms since January 2000. Austin is up 68.30 percent. Two and a half decades of dramatically different journeys, and the destination is roughly the same. But the path between then and now could not have been more different. And understanding that path is the most important thing a buyer, seller, or investor in this market can do right now.
The 2000s: A Tale of Two Markets
From 2000 through 2007, the national market went vertical. Inflation-adjusted prices rose more than 55 percent at the peak in early 2006. Cheap credit, loose underwriting, and speculative demand created the largest housing bubble in modern American history. Austin sat it out. Through the entire run-up of the mid-2000s bubble, Austin's inflation-adjusted price gains hovered between flat and 15 percent. While buyers in Phoenix, Las Vegas, and Miami were watching prices double, Austin moved in a quiet, narrow band. Local economic fundamentals, modest population growth at the time, and a less speculative buyer base all contributed to a market that simply did not participate in the national mania. That discipline paid off in the crash that followed.
The Great Recession: National Collapses, Austin Holds
From the 2006 peak to the 2012 bottom, the national market gave back 35.2 percent in real terms. It took 71 months to find the floor. Millions of homeowners lost equity. Many lost their homes. The 2008 housing crisis defined a generation of real estate behavior. Austin barely flinched. Through the same period, Austin's inflation-adjusted prices declined modestly and recovered quickly. By 2012, both markets were sitting near the same starting line, around flat to slightly positive on a real basis since 2000. National had taken the express elevator up and the express elevator back down. Austin had taken the stairs. This is the moment the modern Austin narrative was born. A market that did not bubble. A market that did not crash. A market that simply kept going.
2012 to 2020: The Slow Climb
For the next eight years, both markets climbed together. The national market recovered methodically, supported by tightened lending standards, demographic demand, and a long economic expansion. Austin tracked national appreciation closely through this period, with the two lines weaving in and out of each other on the chart. By the end of 2019, national was up roughly 40 percent in real terms since 2000. Austin was up roughly 50 percent. Steady. Sustainable. Boring in the best possible way. Then 2020 happened.
The Pandemic Surge: Austin Goes Vertical
What occurred in Austin between 2020 and mid-2022 has no real precedent in modern American housing data. In just over two years, Austin's inflation-adjusted price index surged from roughly 50 percent above its January 2000 baseline to a peak of 141 percent above. That is a real, inflation-adjusted gain of roughly 90 percentage points in 24 months. The chart goes nearly straight up. The drivers are well known. Remote work freed buyers from coastal job centers. Tech migration accelerated. Major employers expanded their Austin footprints. Investor capital poured in. Land in growth corridors became scarce. And a generation of buyers decided Austin was the place to be. The national market also surged during this period, peaking near 76 percent above its 2000 baseline. But Austin's move was nearly twice as large. It was the most violent upward repricing of any major U.S. metro in modern history.
The Correction: Austin Gives It Back
Markets that go vertical rarely stay there. Austin's correction began in mid-2022 and has been one of the defining real estate stories of the last three years. From its 141 percent peak, Austin's inflation-adjusted gains have now compressed to 68.30 percent. That is a real-terms drawdown of more than 70 percentage points. Nearly half of the pandemic-era surge has been erased in inflation-adjusted terms. The national market, by contrast, has barely moved off its highs. National peaked at roughly 76 percent above the 2000 baseline and currently sits at 70.85 percent. A modest 5-point real decline. National did not overshoot. Austin did. And Austin is paying for that overshoot now. This is what a healthy correction looks like in a market that ran too far, too fast.
What the Chart Tells Us Now
After all the volatility, here is where the two markets stand as of February 2026: National inflation-adjusted gain since January 2000: 70.85 percent. Austin inflation-adjusted gain since January 2000: 68.30 percent. For the first time in years, Austin is trailing the national market on a cumulative real-return basis going back to 2000. The runaway outperformer narrative needs updating. Austin's surge was real. So was the correction.
There are three takeaways that matter.
First, time in the market beats timing the market. The Austin owner who bought before 2020 is sitting on a generational real gain, even after the correction. The Austin buyer who paid the 2022 peak is sitting on a real loss. The same house. Two completely different financial outcomes. Entry point matters enormously, but only over short and intermediate horizons. Over 26 years, the path smooths out.
Second, inflation does the quiet work. Most homeowners think about their property value in nominal terms, the dollar number on the Zestimate. But the real story is in inflation-adjusted returns. A nominal price that holds flat for three years while inflation runs at 4 percent is a 12 percent real loss. The current correction is happening through this exact mechanism. Nominal prices are mostly holding. Real prices are quietly adjusting.
Third, structural supply still matters. Austin's land constraints in the urban core, ongoing population growth, and continued employer expansion provide a real floor under the market. The correction is working off the speculative excess of 2020 to 2022, but the long-term fundamentals that drove Austin to outperform for a decade remain intact.
What This Means for Buyers and Sellers Today
For buyers, the math is the most favorable it has been since 2019. Real prices have come down meaningfully. Inventory has improved. Sellers are negotiating. The pandemic-era frenzy is over. This does not mean prices will fall further from here, but it does mean buyers are no longer competing in a winner-takes-all auction environment. For sellers, expectations need to be calibrated to reality. The 2022 comparable sale is no longer the relevant comparable sale. Pricing strategy has to reflect the current market, not the peak. Homes that are priced correctly are still selling. Homes that are priced to 2022 are sitting. For long-term holders, the chart is reassuring. Austin has been through a violent surge and a meaningful correction, and the long-term real return remains strongly positive. The market has not broken. It has normalized.
The Bottom Line
The inflation-adjusted chart of Austin versus the national market since 2000 is one of the most honest pictures of American housing you can find. It strips out the noise. It cuts through the headlines. It shows you what actually happened. What it shows is this: two markets, two completely different paths, one nearly identical destination. Austin's outperformance was real, and so was its overshoot. The national market has been steadier, less dramatic, and ultimately, on a 26-year basis, slightly ahead. The next decade will be defined by the same forces that have always driven housing. Supply. Demand. Demographics. Wages. Interest rates. The next few years specifically will be defined by how quickly the affordability picture improves and how disciplined buyers and sellers remain in a market that has finally stopped sprinting.
The chart will keep telling the story. Pay attention to the one that adjusts for inflation.
Frequently Asked Questions
What does inflation-adjusted home price mean?
An inflation-adjusted home price strips out the effect of general price inflation in the broader economy, showing the real change in purchasing power that a home represents. A home that gained 30 percent in nominal terms during a period of 25 percent inflation only gained 5 percent in real terms.
Why is Austin's correction larger than the national correction?
Austin's pandemic-era surge was nearly twice as large as the national surge. Markets that overshoot to the upside typically give back more during correction phases. Austin ran further than fundamentals supported between 2020 and 2022, and the current correction is working off that excess.
Has Austin lost its long-term outperformance over the national market?
On a cumulative basis since January 2000, Austin is now slightly behind the national market in real terms. Austin sits at 68.30 percent and national at 70.85 percent. This does not mean Austin will continue to underperform, but the runaway outperformer narrative has flattened.
Are home prices going to keep falling in Austin?
The data shows the national market in a slow, controlled softening phase rather than a sustained decline. Austin's correction has been deeper but is showing signs of stabilization. Future direction will depend on mortgage rates, wage growth, inventory levels, and migration patterns.
Is this another 2008-style housing crash?
No. The 2006 to 2012 correction produced a 35.2 percent real decline over 71 months and was driven by widespread credit failure, weak underwriting, and forced liquidation. The current adjustment is roughly 2.6 percent in real terms after 45 months. Underwriting is strong, homeowner equity is high, and there is no forced liquidation dynamic.
Why does the inflation-adjusted view matter more than the nominal view?
Nominal prices can mask what is actually happening to real wealth and purchasing power. A flat nominal price during a period of high inflation is a real-terms loss. The inflation-adjusted view shows whether housing is actually outpacing the broader cost of living, which is the truer measure of housing as an investment.
Should I buy a home in Austin right now?
The market is more favorable to buyers than it has been in five years. Real prices have meaningfully corrected, inventory is healthier, and sellers are negotiating. Whether the timing is right depends on individual financial circumstances, the property in question, and how long you plan to hold. The data supports thoughtful entry rather than waiting for further declines.
What is the National Market Index?
The National Market Index tracks inflation-adjusted U.S. home prices using the ratio of the Home Price Index to the Consumer Price Index. It is updated monthly by Team Price Real Estate and provides a long-term, real-terms view of housing valuation against historical norms.