Is Austin real estate inventory still rising in 2026?
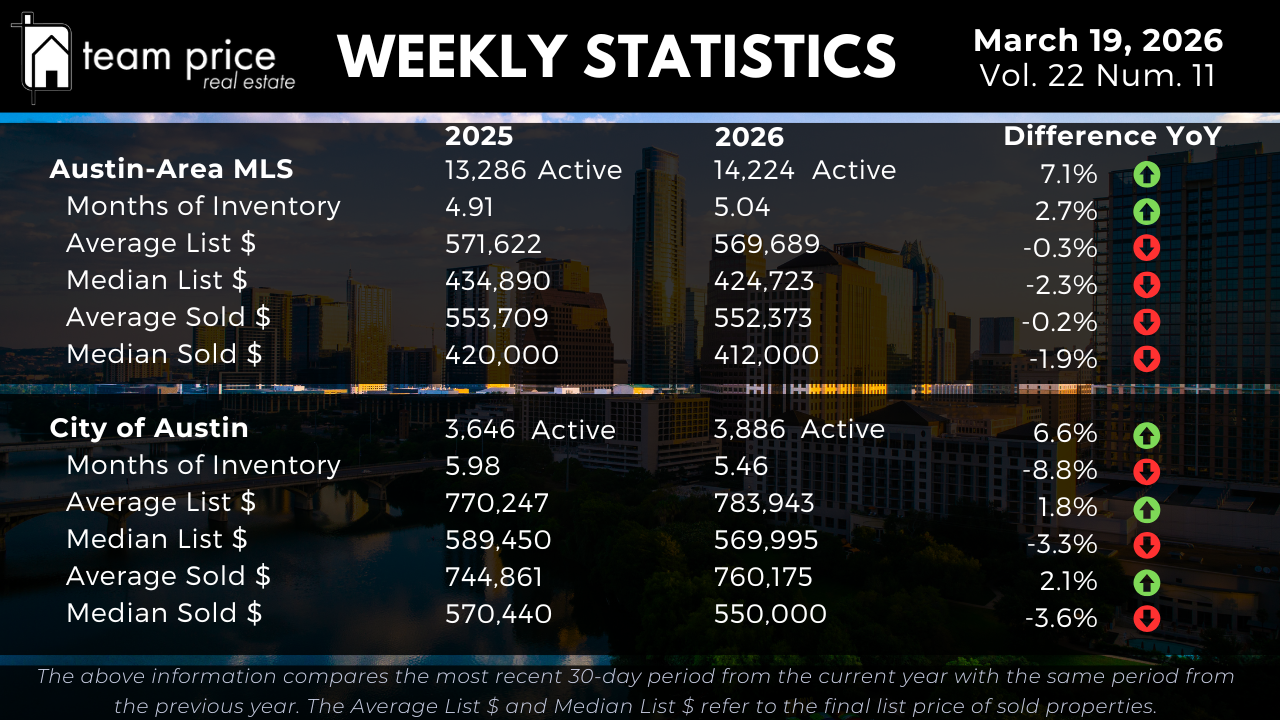
Austin-area inventory is expanding, but the pace is slowing and the city proper is diverging from the broader trend. Active listings across the Austin-Area MLS grew from 13,286 to 14,224 year over year, a 7.1% increase that continues the pattern of supply growth seen throughout the past year. At the current pace of sales, Months of Inventory stands at 5.04 months, up from 4.91 months a year ago — a 2.7% increase that remains well within the moderate range.
The City of Austin is moving in the opposite direction on a key measure. Active listings inside the city rose from 3,646 to 3,886, a 6.6% year-over-year gain. But Months of Inventory fell from 5.98 to 5.46, an 8.7% decline year over year. Supply is growing inside Austin's city limits, but demand is absorbing it faster than it did a year ago. That combination — more listings, faster absorption — is part of what is pushing city prices higher even as the metro plateaus.
What are Austin home prices doing in March 2026?
Austin home prices across the broader MLS are remarkably flat year over year by sold metrics, while list prices continue to show modest softening. The average active list price slipped from $571,622 to $569,689, a decline of just 0.3%. The median active list price fell from $434,890 to $424,723, down 2.3%. Sellers across the metro are pricing with more discipline than a year ago, but the gap between where sellers list and where buyers close has narrowed.
On the sold side, the average sold price in the Austin-Area MLS moved from $553,709 to $552,373, a 0.2% year-over-year decrease — essentially unchanged. The median sold price declined from $420,000 to $412,000, a 1.9% drop. These figures reflect a metro-wide market that has found a rough equilibrium: prices are no longer falling sharply, but meaningful appreciation has not yet returned across the broader Greater Austin MLS.
How are City of Austin home prices trending this week?
The City of Austin is telling a more nuanced story than the metro, and it depends on whether you look at list prices or sold prices. On the list side, the average active list price rose from $770,247 to $783,943, up 1.8%, while the median active list price slipped from $589,450 to $569,995, down 3.3%. The divergence between average and median list prices suggests that higher-end inventory is being listed more aggressively while mid-range sellers are pulling back.
The closed-sale data is where Austin proper separates most clearly from the broader market. The average sold price climbed from $744,861 to $760,175, a 2.1% year-over-year increase. The median sold price moved from $570,440 to $550,000, a 3.6% decline. The gap between a rising average and a falling median sold price reflects a market where upper-tier transactions are gaining strength while the mid-market is still adjusting. Buyers and sellers inside Austin's city limits are operating in a price environment that cannot be read accurately through metro-wide numbers alone.
Who has the upper hand at the negotiating table right now?
Buyers still hold a measurable advantage on balance, but the data suggests that advantage is compressing at the upper end. The average sold-to-list price ratio this week is 97.49%, meaning the typical Travis County home is selling for approximately 2.5% below its final list price. That headline figure is stable, but the composition underneath it is shifting.
The share of homes selling under list price declined from 67.91% last month to 65.68% this month. The share selling at list price edged down from 21.17% to 20.30%. The share selling over list price climbed from 10.92% last month to 14.03% this month — above the 13.11% recorded during the same period in March 2025. That last figure matters: the over-list share is not just recovering from recent lows, it is running ahead of where it was a year ago. Buyers who assume uniform negotiating leverage across all price points and all neighborhoods may be surprised. Well-priced homes in high-demand areas are drawing competition, while overpriced listings continue to sit.
How are prices moving across Austin-area cities and ZIP codes?
The month-over-month picture across Central Texas cities and ZIP codes is more positive than the year-over-year data suggests. Among the 30 cities tracked in the Greater Austin market, 18 of 30 — 60% — posted a month-over-month price increase this week, while 12 of 30, or 40%, declined. Near-term momentum leans positive.
Year over year, the city-level picture is more pressured. Only 11 of 30 cities — 37% — are showing a price increase compared to this time last year, while 19 of 30, or 63%, are trading lower. Against their 12-month peak values, all 30 tracked cities remain below their highs. Not a single city in the Central Texas market is at or above its recent peak.
The ZIP code data follows a similar pattern. Month over month, 47 of 75 ZIP codes posted a price increase — 63% — while 27 declined. Year over year, only 23 of 75 ZIP codes, or 31%, are up, while 52, representing 69% of all tracked ZIP codes, are lower than this time last year. Against their 12-month peak values, all 75 tracked ZIP codes remain below their highs. The breadth of that peak gap tells the fuller story: even in a week where monthly momentum looks constructive, the year-over-year and peak-to-current comparisons show a market that has not yet recovered its prior highs across any meaningful geographic slice.
How far have Austin home prices fallen from their peak?
Austin-Area MLS prices remain well below their pandemic-era highs, with some metrics showing deeper erosion than others. The average list price peaked at $708,929 in March 2023 and currently sits at $693,109, off $15,820 or 2.2% — the shallowest decline of any metric. The median list price peaked at $539,900 in May 2022 and stands at $460,000 today, a drop of $79,900 or 14.8%.
On the sold side, the average sold price peaked at $664,515 in May 2022 and now stands at $567,124, a decline of $97,391 or 14.7%. The median sold price peaked at $538,000 and is currently $435,000, down $103,000 or 19.1%. Price per square foot has seen the deepest erosion: the average sold price per square foot peaked at $324 in April 2022 and sits at $255 today, down 21.3%, while the median peaked at $280 and now stands at $212, a 24.3% decline from peak.
In the City of Austin, the average list price peaked at $958,641 in September 2025 — a far more recent high — and currently stands at $896,600, off $62,041 or 6.5%. The median list price peaked at $658,589 in May 2022 and is now $599,945, a decline of $58,644 or 8.9%. The average sold price peaked at $847,583 in May 2022 and is currently $762,436, down $85,147 or 10.1%. The median sold price peaked at $680,000 and currently stands at $572,435, off $107,565 or 15.8%. The median sold price per square foot peaked at $393 in April 2022 and currently stands at $212, a mathematically verified decline of $181 or 46.1% from peak — the steepest percentage drop of any metric tracked across either geography this week.
What is the outlook for the Austin real estate market this spring?
The data this week points to a market in the early stages of differentiation — not a uniform recovery, but a selective one. The City of Austin average sold price rising 2.1% year over year while the broader metro holds essentially flat is not a coincidence. It reflects tighter inventory absorption, a rising share of homes selling over list price, and a months of supply reading that is actually declining inside the city even as metro-wide supply continues to build.
Spring historically brings the highest transaction volume of any season in Central Texas real estate. If the trends visible in this week's data continue through the second quarter — more homes selling over list, faster absorption in urban core neighborhoods, city prices firming while the suburbs stabilize — the market dynamic of 2025 may not carry through 2026 intact. Sellers who have been holding back for better conditions may be approaching the window they were waiting for, particularly inside Austin's city limits. Buyers still hold measurable leverage at the metro level, but that leverage is not evenly distributed and may not remain at current levels through the peak of the spring season.