Inventory Growth and Market Balance
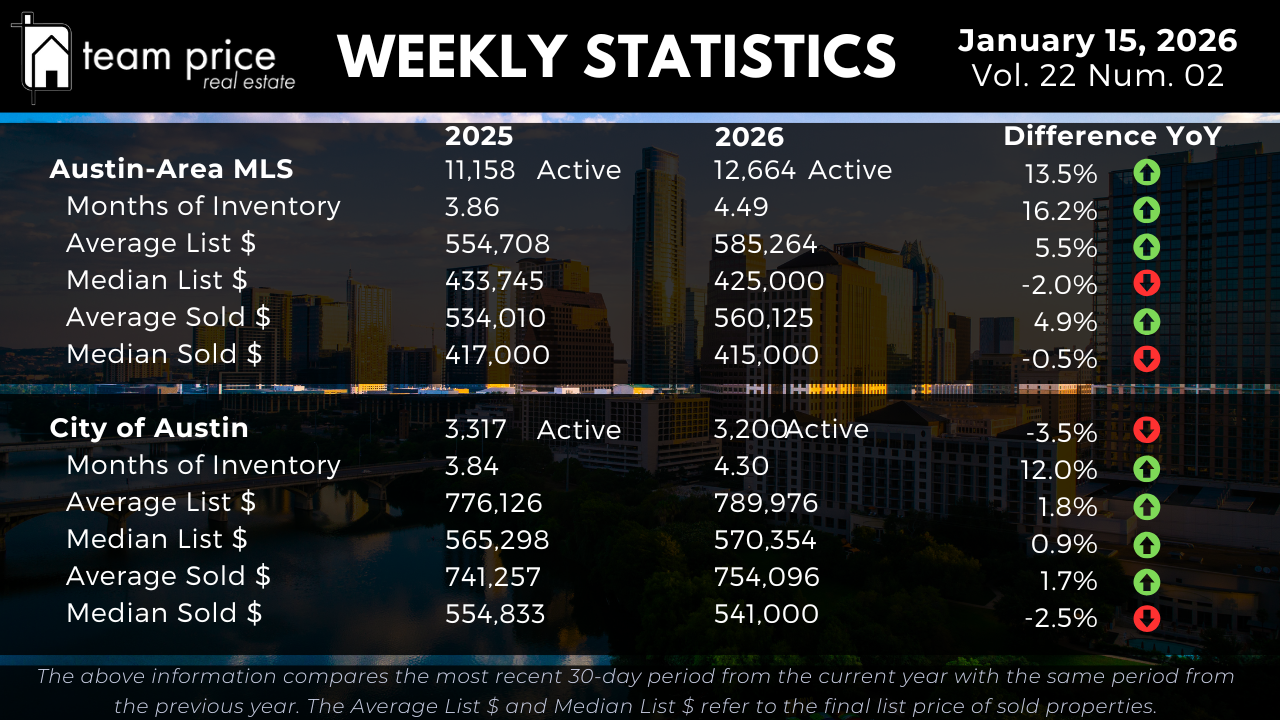
Active residential listings across the Austin-Area MLS totaled 12,664 this week, up from 11,158 at the same point last year, representing a 13.5 percent year-over-year increase in available supply. Compared to the prior week, inventory remains elevated and relatively stable, reinforcing that new listings are continuing to enter the market faster than homes are being absorbed through sales. Based on current sales activity, Months of Inventory has increased from 3.86 last year to 4.49 today, a 16.2 percent year-over-year rise and roughly a 1.2x expansion in supply relative to demand. Week over week, Months of Inventory has edged higher, confirming that market velocity continues to slow as buyers take more time to make decisions.
Inside the City of Austin, inventory dynamics remain more nuanced. Active listings declined modestly from 3,317 last year to 3,200 today, a 3.5 percent year-over-year decrease. However, despite fewer active listings, Months of Inventory increased from 3.84 to 4.30, a 12.0 percent rise. Compared to the prior week, inventory levels inside the city have remained fairly steady, but the increase in Months of Inventory signals slower buyer absorption rather than tightening supply. Homes are taking longer to sell, even with fewer listings available than a year ago, giving buyers more time and leverage than they had at the start of 2025.
Pricing Stability Across the MLS
Pricing across the Austin-Area MLS continues to show a clear split between average and median values. The average active list price increased from $554,708 last year to $585,264 today, a 5.5 percent year-over-year gain. Week over week, average list prices have remained relatively flat, indicating price stability rather than renewed appreciation. This strength at the average level reflects continued activity among higher-priced homes, which tend to influence averages more than medians.
In contrast, the median active list price declined from $433,745 to $425,000, down 2.0 percent year over year. Compared to last week, the median has softened slightly, reinforcing ongoing pressure in the middle of the market where most transactions occur. On the sales side, the average sold price rose from $534,010 to $560,125, a 4.9 percent year-over-year increase, while the median sold price dipped from $417,000 to $415,000, a modest 0.5 percent decline. Week-over-week movement in sold prices has been minimal, suggesting the market is moving sideways, with averages supported by higher-end closings and medians reflecting continued buyer resistance at current price levels.
Pricing Trends in the City of Austin
Within the City of Austin, pricing trends remain mixed, with softness still visible at the median level. The average active list price increased from $776,126 to $789,976, a 1.8 percent year-over-year gain, largely driven by higher-priced inventory. Week over week, average list prices have been stable, signaling that sellers at the top end are holding pricing rather than pushing higher.
The median active list price, however, increased slightly from $565,298 to $570,354, up 0.9 percent year over year. This modest gain reflects stabilization rather than renewed upward momentum. On the sales side, the average sold price rose from $741,257 to $754,096, a 1.7 percent increase, while the median sold price declined from $554,833 to $541,000, a 2.5 percent year-over-year drop. Compared to last week, median sold pricing inside the city remains soft, indicating that price discovery is still ongoing and that buyers continue to negotiate successfully on typical homes.
Negotiation and Buyer Leverage
Negotiation remains a defining feature of the Austin housing market. So far this month, 71.13 percent of all closed sales across the Austin-Area MLS sold below list price, slightly lower than last month’s 71.44 percent but still firmly elevated by historical standards. An additional 18.14 percent of homes sold at list price, up modestly from last month, while 10.72 percent sold above list price, slightly higher than both last month and January 2025. This small uptick in above-list sales reflects isolated competitive situations rather than a broad shift in market dynamics.
The average sold-to-list price ratio currently stands at 96.87 percent, essentially unchanged from last week. This stability confirms that seller concessions and negotiated pricing remain the norm. Buyers continue to have more options, more time, and meaningful leverage, while sellers must compete more aggressively on price and terms to secure a contract.
Regional and ZIP Code Variations
Market conditions continue to vary widely across Central Texas. Of the 30 cities tracked, 12 posted month-over-month price increases this week, while 16 recorded declines. Year over year, 12 cities showed price gains, while 18 experienced declines. Notably, zero cities are currently trading above their peak price levels from the past 12 months, with 29 still below, underscoring how broad-based the correction remains.
At the ZIP code level, dispersion is even more apparent. Among the 75 ZIP codes tracked, 36 recorded month-over-month price increases, while 34 declined. Year over year, 36 ZIP codes posted gains, while 39 saw prices fall. None of the tracked ZIP codes are above their recent peak prices, with 70 still below. This highlights a market that is stabilizing unevenly, with pockets of resilience alongside continued softness across much of the region.
Prices Relative to Peak Levels
When measured against prior market highs, prices across the Austin-Area MLS remain well below peak levels. The average list price is down roughly 11.1 percent from its March 2023 peak, while the median list price is down approximately 21.3 percent from its May 2022 high. The average sold price has declined about 11.6 percent from peak, and the median sold price is down roughly 21.0 percent. On a price-per-square-foot basis, both average and median sold values remain more than 23 to 26 percent below their 2022 highs.
Inside the City of Austin, peak-to-current declines remain meaningful. The average list price is down approximately 11.1 percent from its September 2025 peak, while the median list price is down about 13.5 percent from its May 2022 high. The average sold price has declined roughly 9.8 percent from peak, and the median sold price is down more than 11.6 percent. On a per-square-foot basis, values remain roughly 24 to 28 percent below peak levels, reinforcing that pricing has not fully recovered and remains sensitive to buyer affordability and demand.
Market Outlook
As of mid-January 2026, the Austin housing market is operating in a more balanced environment than it was a year ago. Inventory is higher across the Austin-Area MLS, Months of Inventory continues to trend upward, and most homes are selling below list price. Pricing remains supported at the upper end of the market, but median prices continue to show softness, particularly within the City of Austin.
For buyers, conditions remain favorable, with expanded selection, slower competition, and sustained negotiating leverage. For sellers, success increasingly depends on realistic pricing, strong presentation, and flexibility during negotiations. For investors, the current environment offers opportunities to acquire assets at values that remain meaningfully below peak levels, provided underwriting assumptions remain conservative. The Austin housing market is no longer driven by rapid appreciation, but by balance, discipline, and careful decision-making.