Inventory Growth and Market Balance
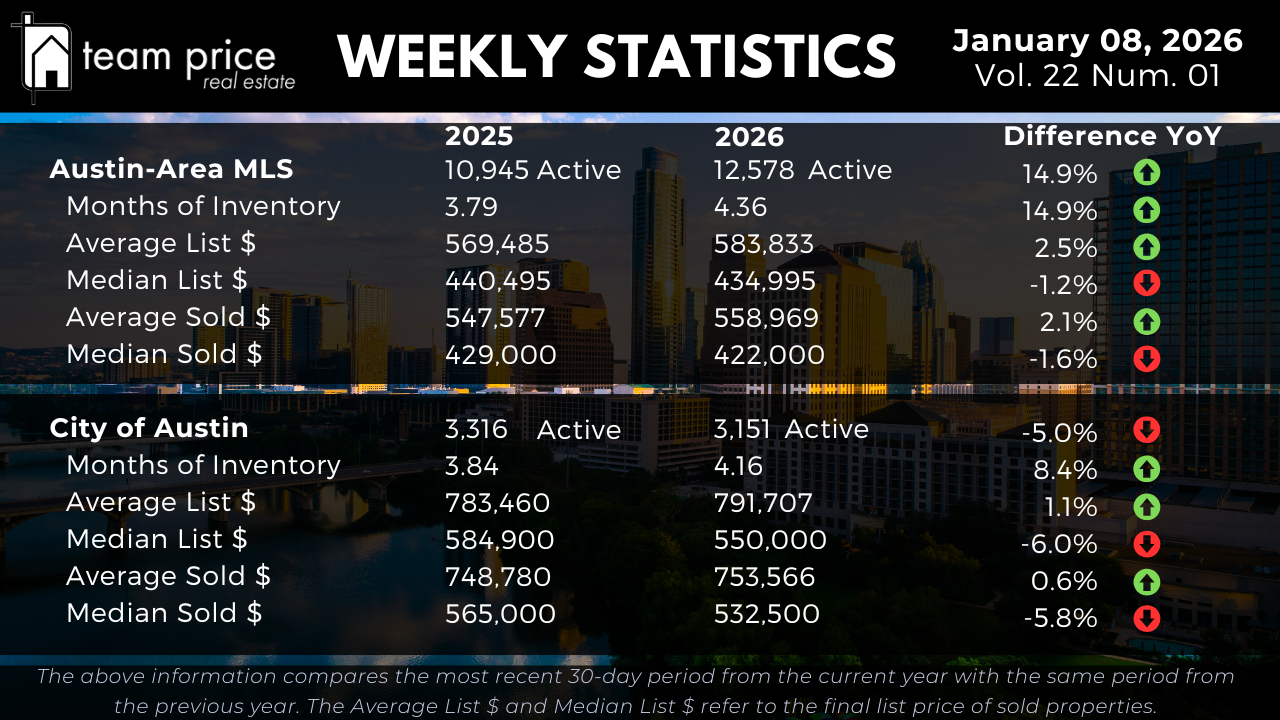
Active residential listings across the Austin-Area MLS totaled 12,578 as of January 8, 2026, up from 10,945 at the same time last year, representing a 14.9 percent year-over-year increase in available supply. Compared to the prior week, inventory remains elevated and stable, reinforcing that new listings continue to exceed the pace of sales. Based on current absorption, Months of Inventory has risen from 3.79 last year to 4.36 today, also a 14.9 percent increase, or roughly a 1.1x expansion in inventory relative to demand. This confirms a clear slowdown in market velocity compared to early 2025 and reflects a market that is no longer supply-constrained.
Inside the City of Austin, inventory trends are more nuanced. Active listings declined from 3,316 last year to 3,151 today, a 5.0 percent decrease. Despite fewer listings, Months of Inventory still increased from 3.84 to 4.16, an 8.4 percent rise. Week over week, inventory inside the city has been relatively steady, but the increase in Months of Inventory signals slower buyer absorption rather than tightening supply. In practical terms, homes are taking longer to sell, even as the number of available listings remains lower than last year. Buyers still have more time and leverage than they did twelve months ago, while sellers are competing for a smaller pool of active demand.
Pricing Stability Across the MLS
Pricing across the Austin-Area MLS continues to show a widening gap between averages and medians. The average active list price increased from $569,485 to $583,833, a 2.5 percent year-over-year gain, reflecting continued activity in the upper price tiers. Week over week, average list prices have remained relatively flat, suggesting price stability rather than renewed appreciation. The median active list price declined from $440,495 to $434,995, down 1.2 percent year over year, indicating persistent pressure in the middle of the market where most buyers operate.
On the sales side, the average sold price rose from $547,577 to $558,969, a 2.1 percent increase year over year, while the median sold price fell from $429,000 to $422,000, a 1.6 percent decline. These opposing movements confirm that higher-priced transactions are lifting averages, while typical homes are selling for less than they did last year. Compared to the prior week, sold pricing metrics have changed very little, reinforcing that the market is not accelerating upward but instead moving sideways with a soft downward bias at the median level.
Pricing Trends in the City of Austin
Within the City of Austin, pricing softness is more pronounced, especially at the median level. The average active list price increased modestly from $783,460 to $791,707, a 1.1 percent year-over-year gain, largely driven by higher-end inventory. In contrast, the median active list price dropped sharply from $584,900 to $550,000, a 6.0 percent decline, signaling meaningful price adjustments in the core of the city market.
Closed sales reflect the same pattern. The average sold price edged up slightly from $748,780 to $753,566, a 0.6 percent increase year over year, while the median sold price declined from $565,000 to $532,500, down 5.8 percent. Week-over-week data shows continued softness at the median level, suggesting that price discovery inside the city is still ongoing. For buyers, this environment creates negotiating opportunities, while for sellers, it underscores the importance of pricing correctly from the start to avoid extended market time.
Negotiation and Buyer Leverage
Negotiation remains a defining feature of the Austin housing market. So far this month, 73.05 percent of all closed sales across the Austin-Area MLS have sold below list price, up from 71.51 percent last month. An additional 17.96 percent of homes sold at asking price, nearly unchanged from the prior month, while just 8.98 percent sold above list price. This marks a continued decline in competitive bidding, down from 10.64 percent last month and 10.80 percent in January 2025.
The average sold-to-list price ratio currently stands at 96.88 percent, confirming that seller concessions are now the norm rather than the exception. Compared to last week, this ratio has remained steady, reinforcing that buyer leverage is not a short-term anomaly but a sustained market condition. Buyers have more choice, more time, and more negotiating power than they have had in several years.
Regional and ZIP Code Variations
Market conditions continue to vary widely across Central Texas. Of the 30 cities tracked, 9 posted month-over-month price increases, while 13 recorded declines. Year over year, 13 cities showed price gains, while 17 experienced declines. Notably, zero cities are above their peak price levels from the past 12 months, with 29 still below, underscoring how broad-based the correction remains.
At the ZIP code level, the dispersion is even clearer. Among the 75 ZIP codes tracked, 26 recorded month-over-month price increases, while 31 declined. Year over year, 31 ZIP codes posted gains, while 43 saw prices fall. None of the tracked ZIP codes are above their recent peaks, with 69 still trading below. This highlights a market that is stabilizing unevenly, with isolated pockets of resilience but widespread softness across most neighborhoods.
Prices Relative to Peak Levels
When measured against prior market highs, prices across the Austin-Area MLS remain well below peak levels. The average list price is down approximately 8.0 percent from its March 2023 peak. The median list price has declined roughly 22.2 percent from its May 2022 high. The average sold price is down about 12.0 percent from peak, while the median sold price has fallen approximately 20.6 percent. On a price-per-square-foot basis, both average and median sold values remain more than 21 to 23 percent below their 2022 highs.
Inside the City of Austin, peak-to-current declines are even more pronounced. The average list price is down roughly 9.0 percent from its September 2025 peak. The median list price has fallen 14.2 percent from its May 2022 high. The average sold price is down approximately 16.4 percent from peak, while the median sold price has dropped more than 22.0 percent. On a per-square-foot basis, values remain roughly 22 to 27 percent below peak levels, reinforcing that the recovery, if any, remains incomplete.
Market Outlook
As of January 2026, the Austin housing market is operating in a clearly more balanced environment than a year ago. Inventory is higher across the Austin-Area MLS, Months of Inventory has expanded, and most homes are selling below list price. Pricing remains supported at the upper end of the market, but median prices continue to trend lower, especially within the City of Austin.
For buyers, conditions remain favorable, with expanded selection, slower competition, and sustained negotiating leverage. For sellers, success increasingly depends on realistic pricing, strong presentation, and flexibility during negotiations. For investors, the market offers opportunities to acquire assets at values that remain 15 to 25 percent below peak levels, provided underwriting assumptions remain conservative. The Austin housing market is no longer driven by rapid appreciation, but by balance, discipline, and strategic decision-making.