• Sign Up
  • Log In
Team Price Real Estate
(512) 213-0213realestate@teamprice.com
  • Search
    • Search Properties
    • Featured Properties
    • Explore Local Guide
    • Browse Properties by Area
    • Browse Properties by City
    • Browse Properties by Zip
    • Browse Properties by Subdivision
    • Browse Properties by School District
  • Buying
    • Home Buyer's Guide
    • Real Estate Forms
    • Mortgage Calculator
    • First Time Home Buying
    • Assuming a FHA home loan
    • Assuming a VA Home Loan
  • Selling
    • Home Seller's Guide
    • Marketing Plan
    • Home Valuation
  • Market Update
    • Data & Analysis
    • Monday Touch Point
    • Daily Update
    • Weekly Update
  • Insight & Statistics
  • Articles
  • About
    • Agents
    • Testimonials
    • About Us
    • Our Guarantee
    • Join Our Team
    • Code Of Ethics
    • EULA
    • Glossary
    • Get your License
  • Contact
  • (512) 213-0213
  • realestate@teamprice.com
    Copy Email
  • Team Price Real Estate
    7320 N Mo-Pac
    Austin, TX 78731
    (512) 213-0213
    dan@teamprice.com

Search

  • Search Properties
  • By City
  • By Subdivision
  • By Zip

Explore

  • Featured Properties
  • Property Search
  • Areas

About

  • Home
  • About
  • Agents
  • Testimonials
  • Contact Us

Resources

  • AustinMetrics
  • Tenant Pre-Screening
  • Real Estate Forms
  • Real Estate Glossary

Company

  • Guarantee
  • Work with Us
  • Interview Questions
  • Join Our Team
Team Price Real Estate - Footer Logo
  • Texas Real Estate Commission Information About Brokerage Services
  • Texas Real Estate Commission Consumer Protection Notice
  • Privacy
  • Terms
  • DMCA
  • Accessibility
  • Fair Housing
©2026 Team Price Real Estate. All rights reserved.
Website built by CloseHack.
Central Texas Multiple Listing Service

Central Texas MLS | Four Rivers Association of REALTORS® All information deemed reliable but not guaranteed. All properties are subject to prior sale, change or withdrawal. Neither listing broker(s) or information provider(s) shall be responsible for any typographical errors, misinformation, misprints and shall be held totally harmless. Listing(s) information is provided for consumer's personal, non-commercial use and may not be used for any purpose other than to identify prospective properties consumers may be interested in purchasing. The data relating to real estate for sale on this website comes in part from the Internet Data Exchange program of the Multiple Listing Service. Real estate listings held by brokerage firms other than Team Price Real Estate may be marked with the Internet Data Exchange logo and detailed information about those properties will include the name of the listing broker(s) when required by the MLS. Copyright ©2022 All rights reserved.

North Texas Real Estate Information Systems

© 2023 North Texas Real Estate Information Systems, Inc. All rights reserved. Disclaimer: All information deemed reliable but not guaranteed and should be independently verified. All properties are subject to prior sale, change or withdrawal. Neither listing broker(s) nor Team Price Real Estate shall be responsible for any typographical errors, misinformation, misprints and shall be held totally harmless. The database information herein is provided from and copyrighted by the North Texas Real Estate Information Systems, Inc. NTREIS data may not be reproduced or redistributed and is only for people viewing this site. All information provided is deemed reliable but is not guaranteed and should be independently verified. The advertisements herein are merely indications to bid and are not offers to sell which may be accepted. All properties are subject to prior sale or withdrawal. All rights are reserved by copyright

Austin Board of Realtors

The information being provided is for consumers' personal, non-commercial use and may not be used for any purpose other than to identify prospective properties consumers may be interested in purchasing. Based on information from the Austin Board of REALTORS®. Neither the Board nor ACTRIS guarantees or is in any way responsible for its accuracy. All data is provided "AS IS" and with all faults. Data maintained by the Board or ACTRIS may not reflect all real estate activity in the market.

  • MLSGrid IDX Data Notice
  • DMCA Notice
LERA MLS

Information provided Courtesy of LERA MLS - Local Expertise Regional Access. IDX information is provided exclusively for consumers' personal, non-commercial use and may not be used for any purpose other than to identify prospective properties consumers may be interested in purchasing. Information is believed to be accurate but not guaranteed. Provided courtesy of the San Antonio Board of Realtors. Copyright 2025 LERA MLS, All Rights Reserved.

Greater McAllen Association of Realtors

IDX information is provided exclusively for personal, non-commercial use, and may not be used for any purpose other than to identify prospective properties consumers may be interested in purchasing. Information is deemed reliable but not guaranteed.

Austin Suburbs Split 50/50 on Inventory
May 2026 Austin Housing Update

Austin Real Estate Market Update May 07, 2026 | Daily Briefing

The Austin housing market in May 2026 is telling two completely opposite stories at the same time, and the cleanest way to see that split is to look at how Months of Inventory has shifted year over year across the metro's 30 tracked cities.

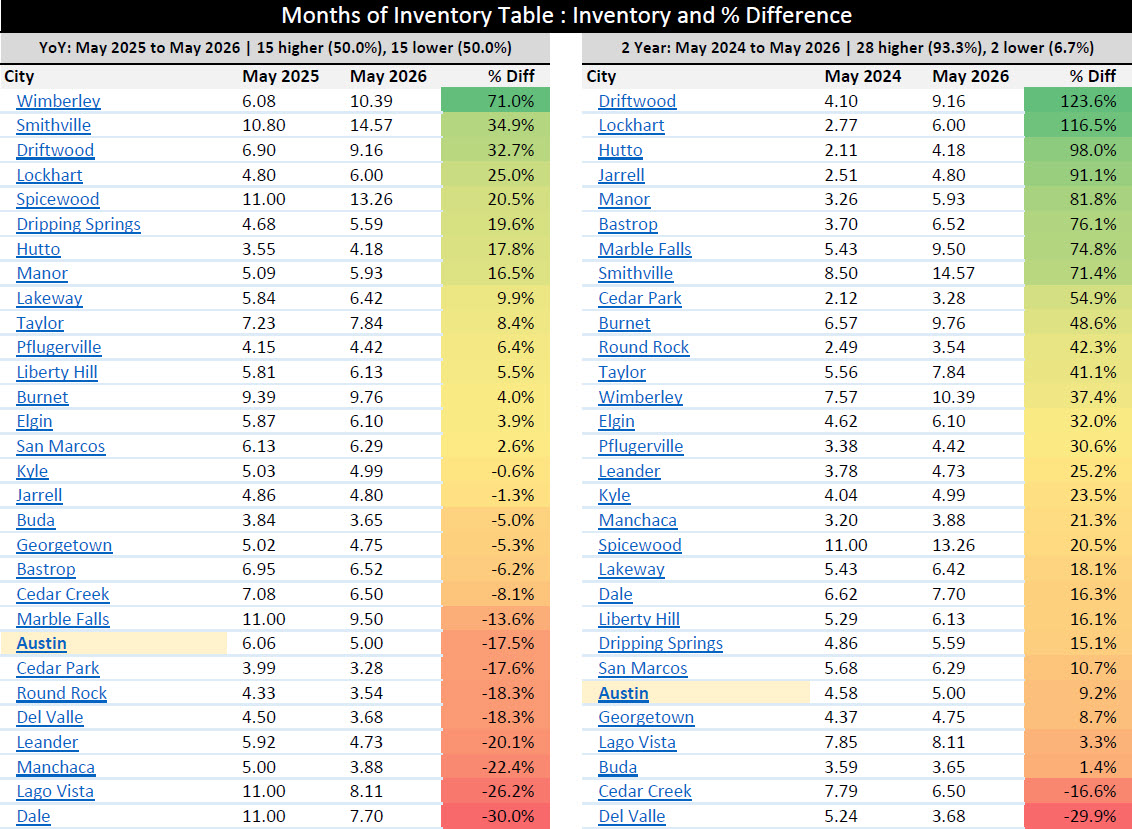
When we line up May 2025 against May 2026, exactly 15 cities have higher Months of Inventory than they did a year ago, and exactly 15 cities have lower Months of Inventory than they did a year ago. That is a perfect 50/50 split, and it is one of the most striking patterns in today's Austin real estate update. The metro-wide number looks calm on the surface, with active listings at 16,200, down just 0.44 percent from 16,271 last May, and Months of Inventory easing slightly from 5.80 to 5.66. But underneath that calm headline, half the metro is tightening and half is loosening, and that divergence has real consequences for buyers, sellers, investors, and agents.

Scroll down to view the full Austin Daily Real Estate Briefing PDF for May 07, 2026.

Let's start with the half that is tightening. The biggest year-over-year improvements in supply, meaning the steepest drops in Months of Inventory, are happening in some of the metro's most established suburbs. Lago Vista has dropped from 11.00 months to 8.11 months, a 26.2 percent improvement. Dale has fallen from 11.00 to 7.70, a 30.0 percent drop. Manchaca has eased from 5.00 to 3.88, a 22.4 percent improvement. Leander has tightened from 5.92 to 4.73, down 20.1 percent. Round Rock has improved from 4.33 to 3.54, a 18.3 percent drop. Del Valle has fallen from 4.50 to 3.68, also down 18.3 percent. Cedar Park has tightened from 3.99 to 3.28, down 17.6 percent. Austin proper has improved from 6.06 to 5.00, down 17.5 percent. Marble Falls has eased from 11.00 to 9.50, down 13.6 percent. These are the markets where supply pressure is genuinely relaxing, where sellers have a little more confidence than they did last spring, and where the Austin housing forecast looks meaningfully brighter than it did twelve months ago.

Now flip to the other half. Wimberley has climbed from 6.08 months to 10.39 months, a 71.0 percent jump in supply. Smithville has gone from 10.80 to 14.57, up 34.9 percent. Driftwood has risen from 6.90 to 9.16, up 32.7 percent. Lockhart has climbed from 4.80 to 6.00, up 25.0 percent. Spicewood has gone from 11.00 to 13.26, up 20.5 percent. Dripping Springs has risen from 4.68 to 5.59, up 19.6 percent. Hutto has climbed from 3.55 to 4.18, up 17.8 percent. Manor has gone from 5.09 to 5.93, up 16.5 percent. Lakeway has eased upward from 5.84 to 6.42, up 9.9 percent. Taylor, Pflugerville, Liberty Hill, Burnet, Elgin, and San Marcos round out the other half of the list, with smaller but still meaningful inventory increases. These are the markets where buyers have gained leverage over the last year, where sellers face more competition, and where the Austin real estate forecast remains tilted in favor of patient buyers.

The split itself is the headline. In a market that often gets discussed as if it moves in a single direction, today's data shows that the Austin housing market is actually moving in two directions at once, and which direction matters depends entirely on which suburb you are watching.

Step back and the metro-wide context still matters. Pending listings are up 3.8 percent year over year at 5,122, which is a leading indicator that demand is improving across the broader market. New construction pendings account for 1,810 of that total, while resale accounts for 3,312. The Activity Index has climbed from 23.3 percent in May 2025 to 24.0 percent in May 2026, with new construction running at 32.53 percent and resale at 21.02 percent. Builders are still moving product faster than the resale market, and that gap has been a consistent theme in the Austin real estate forecast.

Sales volume is also encouraging. May closed 3,185 properties, up 2.0 percent year over year, and cumulative sales from January through May reached 12,709, which is 3.5 percent above last year and 15.8 percent above the long-term average. Even with a market that is split 50/50 on inventory, the actual transaction volume is running ahead of historical norms.

Pricing tells its own story. The median sold price came in at $450,950 for May, which is 1.8 percent above May 2025 and the highest monthly median we have seen since last summer. The average sold price climbed to $613,514, up 5.2 percent year over year. The 36-month price comparison is at negative 2.18 percent, the smallest gap we have seen in over a year. The market remains 18.0 percent below the May 2022 peak of $550,000, and based on the 25-year compound appreciation rate of 4.793 percent, it would take approximately 53 months, or until September 2030, to climb back to that prior high.

For buyers, the 50/50 split is the most important takeaway in today's Austin market update. If you are shopping in a suburb where Months of Inventory has dropped year over year, like Cedar Park, Round Rock, Leander, or Lago Vista, you should expect more competition and less negotiating room than you would have had last spring. If you are shopping in a suburb where Months of Inventory has risen year over year, like Wimberley, Smithville, Driftwood, or Hutto, you have meaningfully more leverage than buyers had a year ago, and you should not hesitate to negotiate. The 49.3 percent metro-wide price drop rate confirms that sellers across the board are already adjusting expectations.

For sellers, the same logic applies in reverse. Sellers in tightening cities can price with more confidence than they could last May. Sellers in loosening cities need to be sharper on pricing from day one, because the buyer pool has more options and is prepared to wait.

For investors, the absorption rate of 20.44 percent remains well below the historical average of 31.40 percent, but the Market Flow Score of 4.62 is showing signs of improvement after sitting near multi-year lows last year. The 50/50 split also creates targeted opportunities, since some submarkets are clearly recovering faster than others, and that uneven recovery is where investors with local knowledge can find an edge.

For real estate agents, today's data is a reminder that broad market commentary does not serve clients well. With half the metro tightening and half loosening, the conversation has to be city-specific and even zip-code-specific. Knowing whether your client's target suburb falls into the 15 tightening cities or the 15 loosening cities is the difference between accurate guidance and missed expectations.

Austin Daily Real Estate Briefing at teamprice.com/austin-daily-real-estate-briefing for the complete archive of daily market data.

If this PDF does not display, click here to open in a new tab .

FAQ Section

Is now a good time to buy a home in Austin?

For many buyers, yes, but the answer depends entirely on which suburb you are targeting because the Austin housing market is split exactly 50/50 on year-over-year inventory changes. In the 15 cities where Months of Inventory has fallen, like Cedar Park down 17.6 percent or Round Rock down 18.3 percent, you will face more competition than you would have last spring. In the 15 cities where Months of Inventory has risen, like Wimberley up 71.0 percent or Smithville up 34.9 percent, you have significantly more leverage than buyers had a year ago. With 49.3 percent of all 16,200 active listings carrying at least one price drop, there is room to negotiate across most of the metro, but the strongest deals are concentrated in the loosening half of the market.

Are home prices dropping in Austin Texas?

The metro-wide median sold price actually rose 1.8 percent year over year to $450,950 in May 2026, and the 36-month price comparison has narrowed to negative 2.18 percent, the smallest gap we have seen in more than a year. However, the broader Austin real estate market remains 18.0 percent below the May 2022 peak of $550,000, and 24 of 30 tracked cities are showing year-over-year declines in median sold price. Marble Falls is down 18.1 percent and San Marcos is down 11.2 percent, while Wimberley is actually up 22.1 percent. So the answer is that prices are stabilizing at the metro level but still falling in most individual cities.

What is the Austin housing market forecast for 2026?

The Austin real estate forecast for the remainder of 2026 points to a slow and uneven recovery, with the 50/50 split in Months of Inventory being the defining feature of the year so far. Pending listings are up 3.8 percent year over year at 5,122, the Activity Index has climbed to 24.0 percent from 23.3 percent last May, and cumulative sales through May are 3.5 percent above last year and 15.8 percent above the long-term average. The Market Flow Score of 4.62 has improved off recent lows but remains well below the historical average of 6.56. Based on the 25-year compound appreciation rate of 4.793 percent, the median price would need approximately 53 months, or until September 2030, to recover to the 2022 peak.

How does Austin inventory compare to historical levels?

Active listings at 16,200 are slightly below the 16,271 we saw in May 2025 and well below the June 2025 peak of 18,146, but they remain elevated compared to pre-pandemic norms. Cumulative new listings from January through May reached 19,720, which is down 21.1 percent year over year but still 6.8 percent above the long-term average. Metro-wide Months of Inventory has eased from 5.80 to 5.66, but the bigger story is that 15 of 30 tracked cities have higher inventory than a year ago and 15 have lower inventory. That perfect split makes the metro look calm in aggregate while masking real divergence at the city level.

Which Austin cities have the most price drops right now?

When measured by year-over-year median sold price decline, Marble Falls leads with an 18.1 percent drop, followed by San Marcos at negative 11.2 percent, Lockhart at negative 9.7 percent, Elgin at negative 9.2 percent, and Cedar Creek at negative 8.8 percent. When measured by the share of active listings carrying at least one price reduction, Manchaca has 68.2 percent of its active listings with price drops, followed by Hutto at 59.8 percent, San Marcos at 59.1 percent, Jarrell at 58.1 percent, and Taylor at 56.5 percent. Notably, several of the cities with the deepest year-over-year price declines also fall into the half of the metro where Months of Inventory has risen, which reinforces why supply pressure and price pressure tend to move together in the Austin housing market.

Austin's Real Estate Market. Right in Your Pocket.

Get instant access to the most accurate, up-to-date Austin housing market data anywhere you go. AustinMetrics delivers live stats across 30 cities and 75 zip codes, 55+ professional market reports, interactive charts, heat maps, and a daily market briefing, all completely free. Whether you're buying your first home, selling, investing, or just keeping a pulse on the market, you'll have the same data Austin's top agents rely on, available the moment you need it. No logins, no fees, no fluff. Just real numbers, updated daily.

Download on the App Store Get it on Google Play
AustinMetrics App

Have a Question or Want to Dive Deeper?

If you’d like a custom breakdown of the data, want help interpreting today’s market trends, or just have a question about buying or selling in Austin, let us know. Fill out the form below and a member of our team will get back to you promptly.