Renting vs. Buying in Austin – What the Data Says About Your Options in 2025
When people search “Is it better to rent or buy in Austin?” they’re looking for clear answers about one of Texas’s hottest housing markets. The decision depends on factors like how long you plan to stay, where you want to live, and what you can afford. To dig into this, we’ll use detailed numbers from the "Renting vs Buying Analysis" and "Appreciation Year over Year" reports by Team Price Real Estate, both updated daily (M-F). These reports cover everything from monthly costs to long-term home price trends, giving us a solid foundation to explore this question.
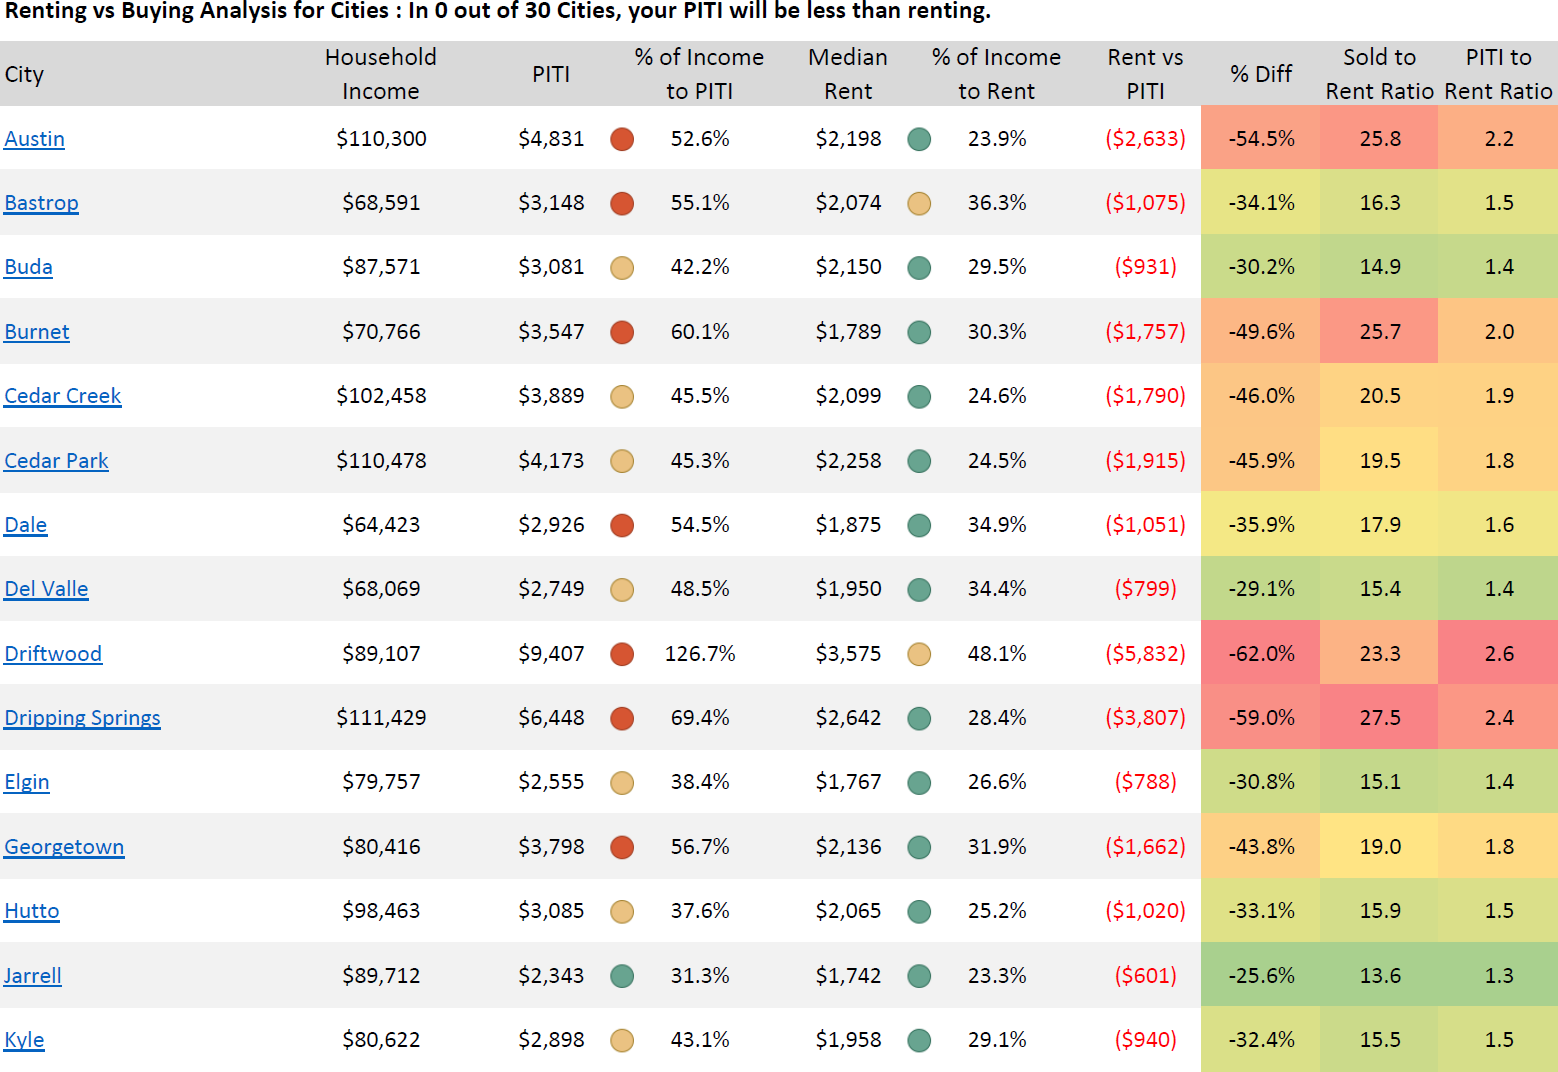
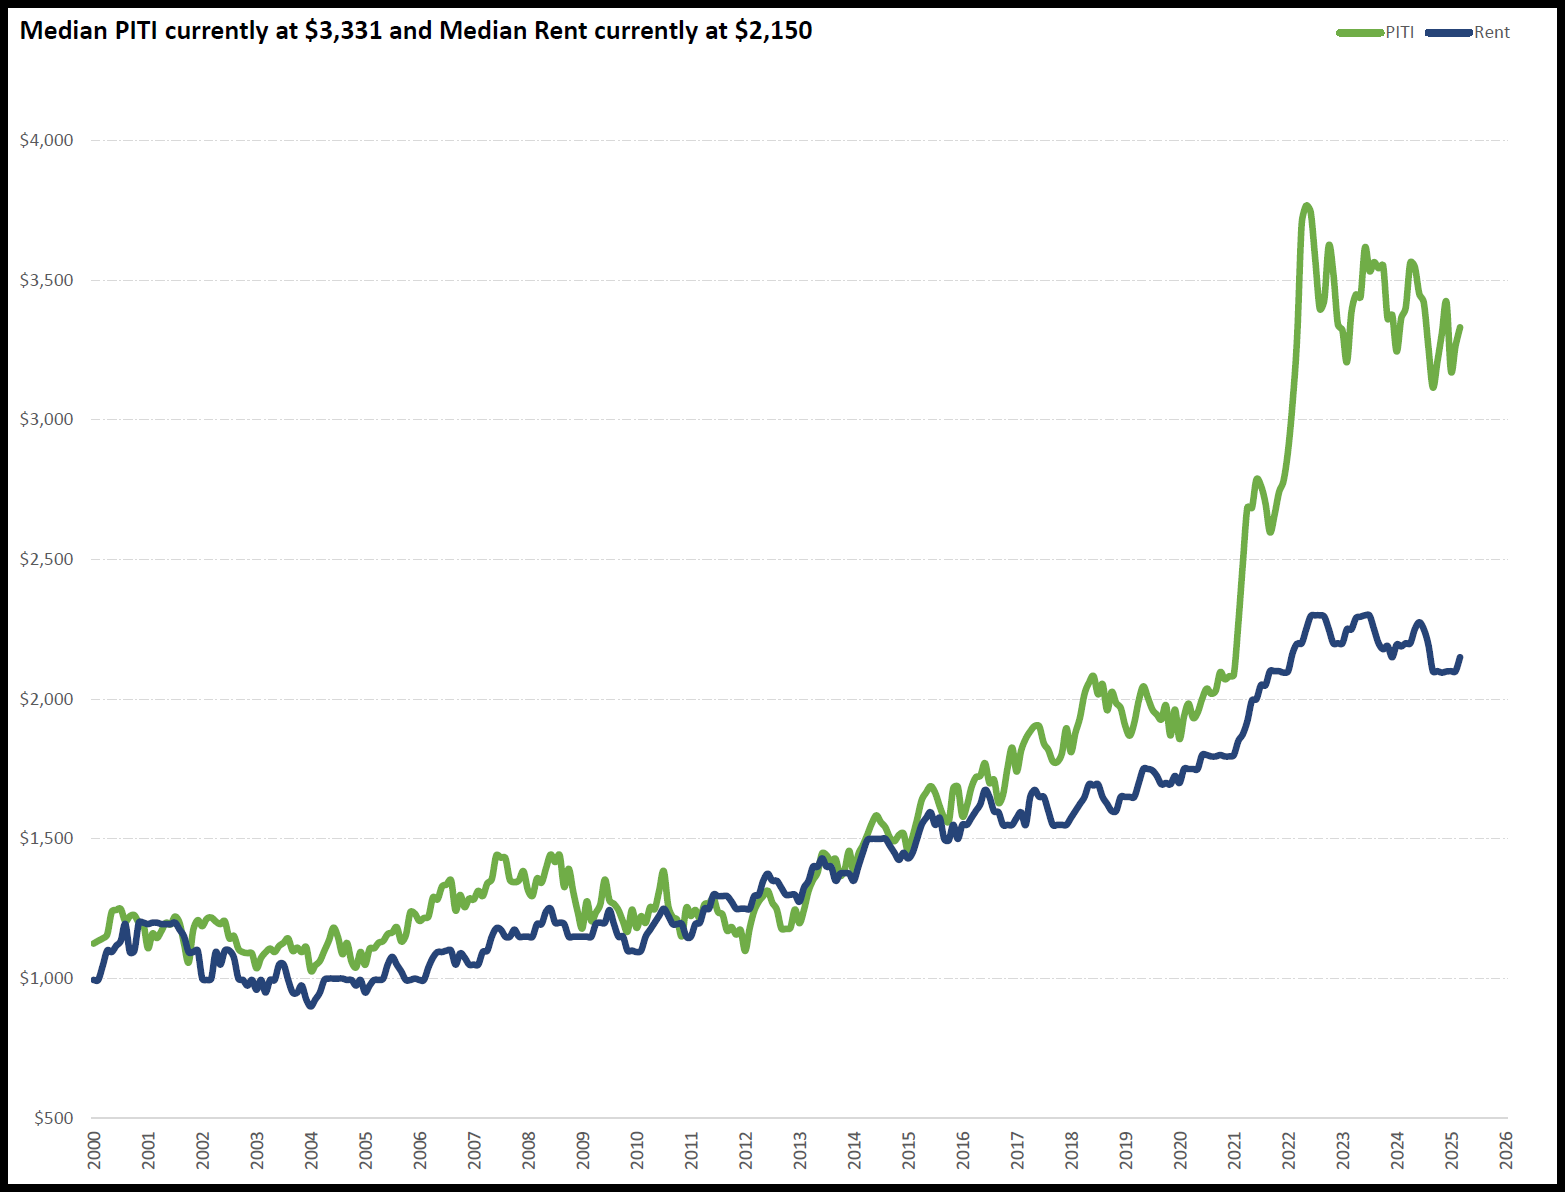
Let’s start with the basics of cost. In 2025, the median monthly payment for owning a home in the Austin area, known as PITI (Principal, Interest, Taxes, and Insurance), sits at $3,331. Compare that to the median rent of $2,150, and you’re looking at a $1,181 difference every month. That gap shows up everywhere in the data. In the city of Austin itself, PITI averages $4,831 while rent is $2,198, leaving a $2,633 monthly difference. Even in smaller towns like Jarrell, PITI is $2,343 against a rent of $1,742, a $601 gap. Across 30 cities and 75 zip codes analyzed, not a single place has a PITI lower than its median rent. This means that if you’re just looking for a place to live for the next year, renting costs less upfront.
Income plays a big role too. The data shows how much of your paycheck goes to housing. In Austin, with a median household income of $110,300, PITI takes up 52.6% of that income, while rent uses 23.9%. In San Marcos, where income is lower at $42,500, PITI eats up 82.3% compared to rent’s 33.2%. Even in a higher-income spot like Lakeway ($142,566), PITI is 53.8% of income versus rent’s 26.2%. Across the board, renting takes a smaller bite out of your budget, which matters if you’re planning short-term.
But what if you’re thinking longer-term, like five years or more? That’s where home price growth comes into focus. The "Appreciation Year over Year" report tracks how much homes have gone up in value since 2000. In Austin, the average sold price jumped from $218,205 in 2000 to $755,043 in 2025, a 246% increase. That works out to a compound annual growth rate (CAGR) of 5.1% over 25 years. In Driftwood, prices soared from $314,821 to $1,307,043, a 315% rise and a 5.9% CAGR. Leander saw a 307% increase, from $129,266 to $526,284, with a 5.8% CAGR. Even in Kyle, a more affordable area, prices grew from $108,258 to $356,919, a 230% jump and 4.9% CAGR. These numbers show that homes in the Austin region have steadily climbed in value, building equity for owners over time.
Looking at median sold prices tells a similar story. In Austin, the median went from $159,900 in 2000 to $556,000 in 2025, a 253% increase with a 5.2% CAGR. Driftwood’s median shot up from $252,500 to $1,200,000, a 375% rise and 6.4% CAGR. Cedar Creek hit a 304% increase, from $103,398 to $427,495, with a 5.7% CAGR. Even in San Marcos, where growth was slower, the median rose from $146,900 to $350,495, a 139% increase and 3.5% CAGR. This consistent growth over decades highlights how owning a home can pay off if you stay put for a while.
The PITI-to-rent ratio adds another layer. Back in 2000, this ratio was 1.1, meaning PITI and rent were almost equal. By 2025, it’s up to 1.5 across the region, showing PITI has outpaced rent. In Austin, it’s 2.2 ($4,831 PITI vs. $2,198 rent), while in Driftwood, it’s 2.6 ($9,407 vs. $3,575). The ratio peaked at 1.7 in May 2022, suggesting some ups and downs over time. Over a five-year span, you might see this ratio shift, but the long-term trend of rising home values could still make buying worthwhile.
Location makes a difference too. In high-cost areas like Driftwood, the PITI of $9,407 towers over the $3,575 rent, but the 6.4% CAGR signals big gains for owners. In Jarrell, PITI is $2,343 and rent is $1,742, a smaller gap, with a 4.0% CAGR that’s steady but less dramatic. Zip code data gets even more specific. In Austin’s 78703 zip code, PITI is $13,212 versus $2,892 rent, with a median sold price of $1,500,000 in 2025 (up from $312,500 in 2000, a 380% rise). In 78725, PITI is $2,205 and rent is $1,908, with a median sold price of $275,000 (164% growth since 2000). Your spot in the Austin area shapes both costs and potential returns.
Income levels tie into this as well. In Driftwood, with a household income of $89,107, PITI takes 126.7% of income, making buying tough without extra savings. In Jarrell, income is $89,712, and PITI is 31.3%, more manageable. Across 75 zip codes, PITI often exceeds 30% of income—a common affordability benchmark—while rent rarely does. For example, in 78741 (income $54,422), PITI is 66.2% and rent is 28.1%. This gap shrinks in wealthier areas like 78733 (income $187,778), where PITI is 75.2% and rent is 23.3%, but renting still costs less upfront.
The data also shows how costs have evolved. In 2007, PITI hit a low of 25.11% of income, per Page 5 of the "Renting vs Buying Analysis," while in April 2022, it spiked to 68.19%. Today’s $3,331 PITI versus $2,150 rent lands at a 24.14% income share for rent and about 37.5% for PITI (assuming a $106,692 median income derived from the $3,331 PITI at 37.5%). Over time, owning has gotten pricier relative to renting, but the equity from appreciation keeps it in the game for long-term planners.
So, what does this all mean for Austin in 2025? If you’re staying for just a year, the numbers lean toward renting—lower monthly costs and less financial strain. But if you’re in for five years or more, the data points to buying, with home values growing at 4% to 6% annually across cities and zip codes. A $500,000 home at a 5.1% CAGR (Austin’s average) would hit $638,140 in five years and $814,628 in ten. Renting at $2,150 monthly totals $129,000 over five years with nothing to show for it. The choice depends on your timeline and where you land in this sprawling market.
1. How much does it cost to rent vs. buy in Austin in 2025?
In 2025, the median PITI for owning a home in the Austin area is $3,331 per month, while the median rent is $2,150, a $1,181 difference. In Austin city, PITI averages $4,831 and rent is $2,198. In Jarrell, it’s $2,343 PITI versus $1,742 rent. Across 30 cities and 75 zip codes, PITI always exceeds rent, per the "Renting vs Buying Analysis" from Team Price Real Estate.
2. Are home prices in Austin still going up in 2025?
Yes, home prices continue to rise. The "Appreciation Year over Year" data shows Austin’s average sold price grew from $218,205 in 2000 to $755,043 in 2025 (5.1% CAGR). Median sold prices hit $556,000 (5.2% CAGR). Driftwood’s median reached $1,200,000 (6.4% CAGR), while Leander’s average is $526,284 (5.8% CAGR). Growth varies by location but remains steady region-wide.
3. Is renting cheaper than buying a house in Austin?
For 2025, yes, renting is cheaper monthly. The median rent of $2,150 is $1,181 less than the $3,331 PITI. In Austin, rent ($2,198) is $2,633 below PITI ($4,831). Rent takes 24.14% of median income, while PITI takes about 37.5%, per the "Renting vs Buying Analysis." However, buying builds equity over time with appreciation rates of 4-6% annually.