Leander Real Estate Market Update – October 2025 : Understanding where Austin’s fastest-growing suburb is accelerating and where it’s beginning to stall.
Leander has been one of the most telling submarkets in the Austin housing landscape this year. As Austin’s northern suburbs continue to expand, Leander offers a clear look at how buyer demand shifts by price segment — and how the balance between supply and demand determines where the market accelerates or stalls. Across Central Texas, the most reliable indicators of market direction are the Activity Index (a leading measure of demand strength) and Months of Inventory (a lagging measure showing how long it takes for current listings to clear). When analyzed together, they reveal which parts of the market are heating up and which are cooling off.
How to Read This
This analysis uses two key indicators: The Activity Index represents the percentage of homes under contract relative to total available listings — calculated as Pending ÷ (Active + Pending). This is a leading market indicator because it shows where demand is active today. The Months of Inventory represents how many months it would take to sell all active listings at the current pace of sales — calculated as Active ÷ (Average Sold per Month over the past 90 days). This is a lagging indicator that reflects the market’s follow-through and absorption rate. A balanced market typically shows an Activity Index near 25% and around 4–6 months of inventory. Above that, supply is building and homes are sitting longer — a sign of a cooling or stalling market. Below that, demand is strong enough to absorb listings quickly, signaling a seller-favorable environment.
Market Overview
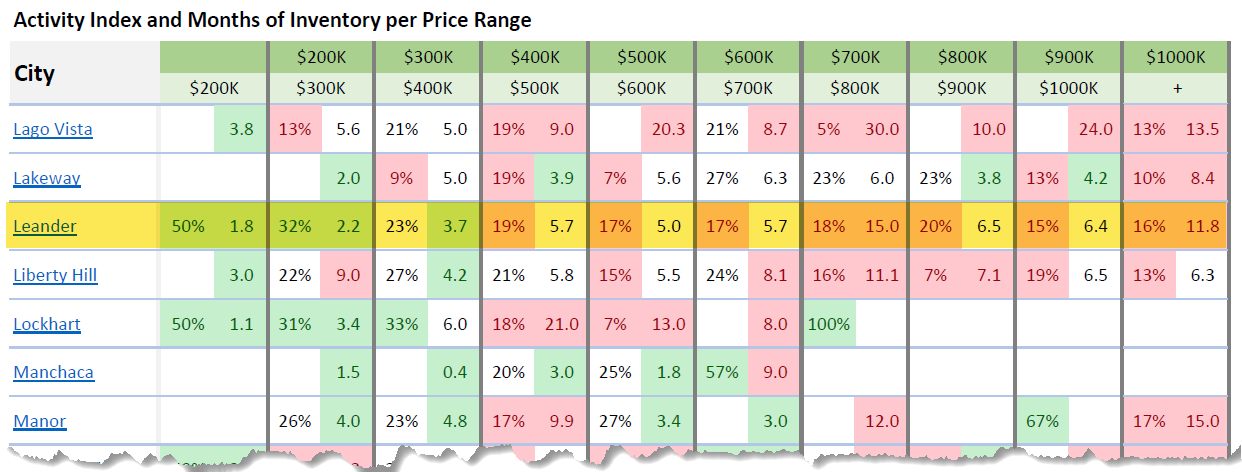
Leander’s housing market remains one of the most data-rich reflections of Austin’s suburban evolution. It combines high construction activity with ongoing resale competition, and the split between the two is widening. The Activity Index spans from a robust 50% at entry-level prices to as low as 16% in the upper tier. Meanwhile, inventory levels range from just under two months to well over ten. This gap — between strong affordability-driven demand and luxury oversupply — highlights where the market is moving and where it’s stalling. It also reinforces how critical pricing precision has become for both sellers and agents in Leander.
Price Segmentation Analysis
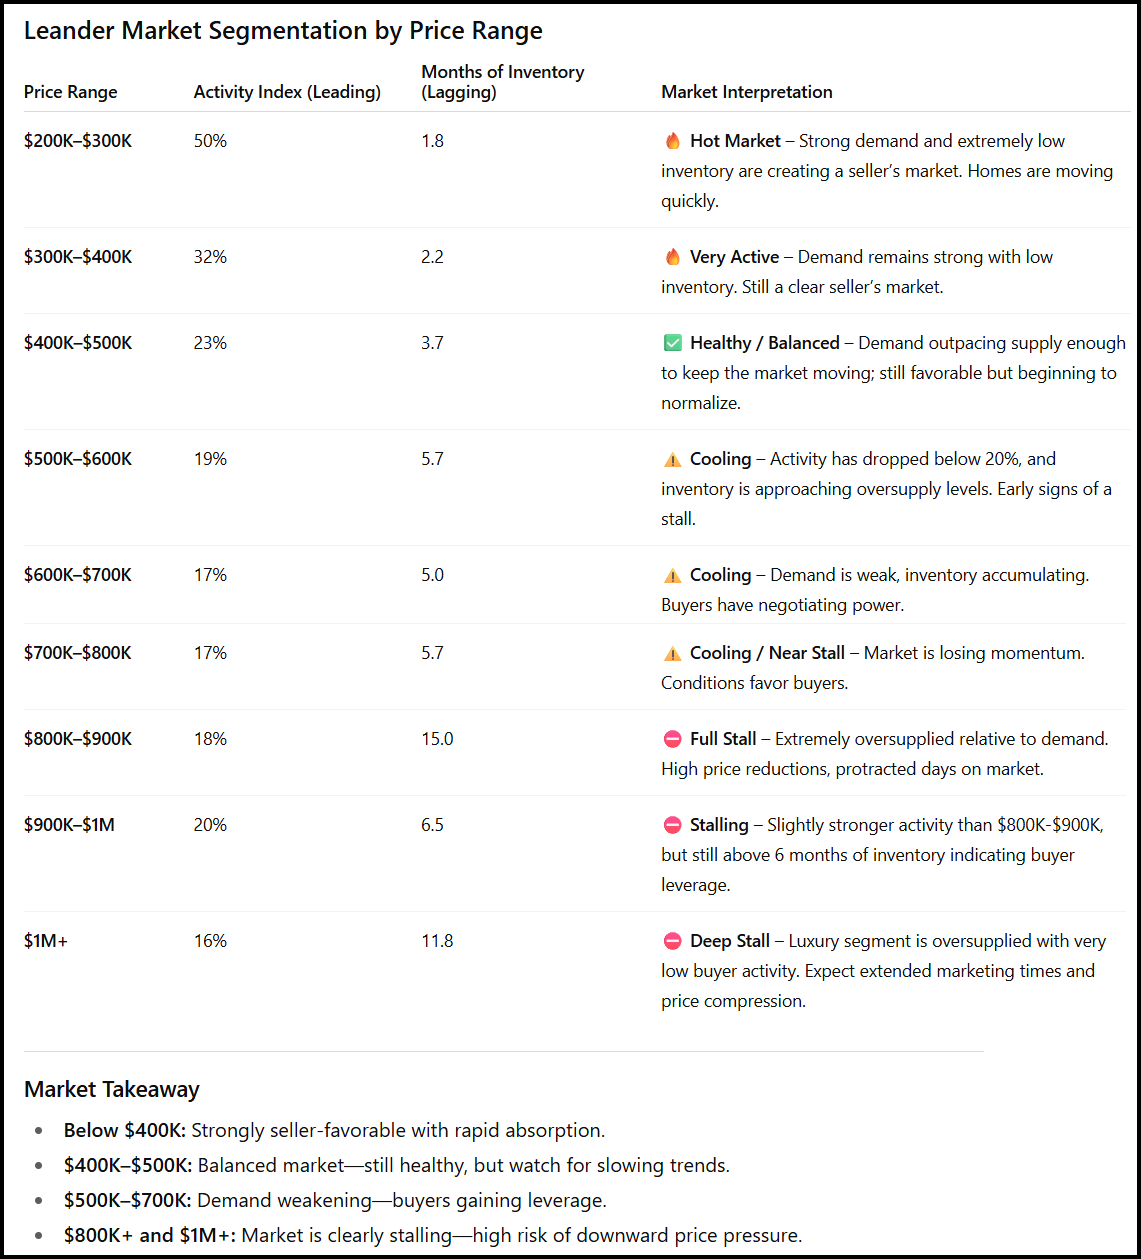
At the entry level ($200K–$300K), Leander’s market remains firmly in seller territory. With an Activity Index of 50% and only 1.8 months of inventory, homes in this range move quickly. This segment attracts both first-time buyers and investors looking for affordability relative to Austin’s city limits. It’s the most liquid part of the market and continues to outperform the metro average.
The $300K–$400K range is still highly active, showing a 32% Activity Index and 2.2 months of inventory. While not as competitive as earlier in the year, it remains healthy. Most of this activity comes from well-priced resale homes and smaller new construction inventory that hit a sweet spot for move-up buyers.
Moving into the $400K–$500K segment, the market begins to normalize. The Activity Index drops to 23% with 3.7 months of inventory, still balanced but no longer accelerating. Homes at this price point need clear differentiation — upgraded finishes, lot value, or location advantages — to capture buyer attention.
The first signs of a stall appear between $500K and $700K. Here, Activity drops to 17–19% while inventory hovers near 5–6 months. These readings signal a cooling environment. Buyer hesitancy and rising mortgage costs are limiting movement, while supply continues to grow from builder projects in western Leander. This zone is shifting from equilibrium toward mild oversupply.
Above $700K, the slowdown becomes pronounced. Between $700K and $900K, demand weakens dramatically — Activity remains below 18%, and Months of Inventory spikes from 5.7 to 15.0. This is the definition of a stalled segment: listings are accumulating faster than they sell, and many are experiencing price reductions or extended marketing periods.
The luxury range ($900K–$1M+) reflects a clear stall. With Activity levels between 16–20% and inventory readings exceeding 6–11 months, these homes face limited absorption. The top end of Leander’s market now operates under a high-supply, low-demand dynamic. Unless prices adjust downward or new buyer pools emerge, this portion of the market will remain sluggish into winter.
Market Implications
For buyers, Leander continues to offer strategic opportunities — especially above $600K, where leverage is strongest. Negotiation power is shifting firmly toward the buyer side in mid-to-upper price bands. For sellers, the data emphasizes timing and pricing strategy. The lower tiers can still command competitive offers when priced correctly, but the middle tiers are no longer immune to slowdown effects. Sellers entering the $600K+ range must prepare for longer days on market and price resistance. For agents, Leander is a prime example of how segmentation can mask true performance. While the overall citywide Activity Index might suggest a “balanced” market, the underlying numbers show two distinct realities — one where entry-level homes are moving, and another where higher-end inventory is stalling. Recognizing which market you’re operating in determines whether you list aggressively or defensively.
Looking Ahead
As we move through Q4, Leander’s role in the broader Austin housing market remains vital. Its affordability advantage keeps it resilient at lower price points, but rising construction costs and persistent rate pressure continue to weigh on upper segments. The split between high-demand affordability and low-velocity luxury is widening — a pattern seen across the metro. If rates stabilize and builders slow new inventory delivery, the lower half of the Leander market should maintain its pace. However, without new demand inflows, the $700K+ ranges will likely remain oversupplied through year-end.
Frequently Asked Questions
1. What is the Activity Index and why does it matter?
The Activity Index measures real-time demand by comparing pending listings to total available listings. A higher percentage means more buyers are active. In Leander, entry-level price ranges above 30% indicate strong absorption, while readings below 20% reflect weak market movement.
2. What’s considered a balanced market in Leander?
A balanced market typically sits near 25% Activity and 4–6 months of inventory. Leander’s sub-$400K segment is hotter than that balance, while anything above $600K is cooler, showing how localized supply and demand vary by price point.
3. Why are luxury homes in Leander stalling?
Luxury inventory has grown faster than demand, particularly as higher mortgage rates limit affordability. With fewer qualified buyers and increased builder output, upper-tier homes are seeing extended days on market and higher price adjustments.
4. How does Leander compare to other Austin suburbs?
Leander is one of the clearest examples of a bifurcated market. Similar patterns exist in Georgetown and Liberty Hill, but Leander’s scale and volume make the contrasts more pronounced — rapid movement under $400K and sluggish performance above $700K.
5. What’s the short-term forecast for Leander’s housing market?
Expect stability at the lower end, with modest price softening above $500K. Inventory will likely remain elevated in the upper tiers unless interest rates ease or builders significantly cut back new deliveries. The mid-range market will determine whether overall activity rebounds in early 2026.