Austin Real Estate : Cap-Rate Spread Nears Neutral for First Time Since 2022
Published | Posted by Dan Price
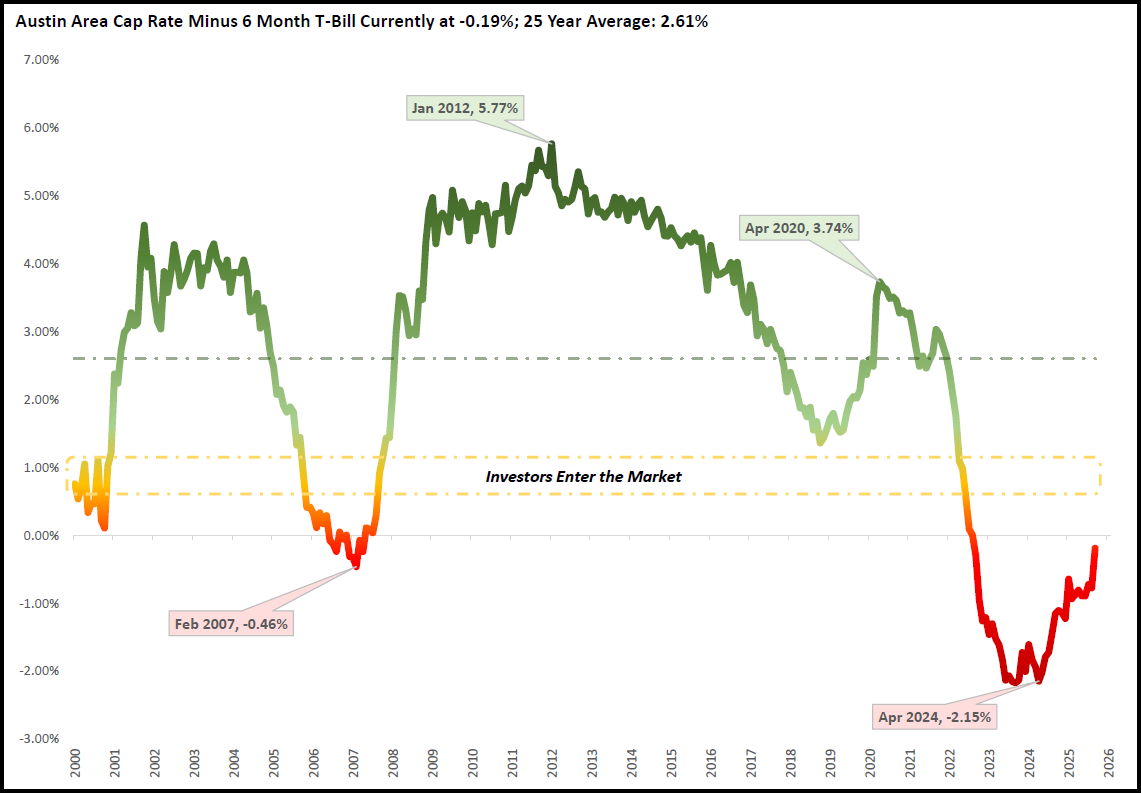
Austin’s investment math is finally turning: for the first time since August 2022, the spread between the Austin-area cap rate and the 6-month Treasury Bill is essentially back to neutral, and that is pulling investors back to the table. In September 2025 the Austin-area cap rate printed 3.77% against a 6-month T-Bill yield of 3.96%, leaving a spread of -0.19%. That compares to a long-run average spread of +2.61%, and it marks a sharp recovery from the April 2024 trough at -2.15% when short-term Treasuries handily out-yielded residential rentals and most investors stepped aside.
From an austin housing forecast perspective, the most important change is the direction of travel. Year over year, the local cap rate moved up from 3.40% in September 2024 to 3.77% in September 2025, while the 6-month T-Bill yield moved down from 4.55% to 3.96%. The net effect is an almost one-percentage-point improvement in the spread, from -1.15% to -0.19%. Month over month, the improvement is also visible: cap rate rose from 3.34% in August 2025 to 3.77% in September, while the T-Bill eased from 4.11% to 3.96%, tightening the gap from -0.77% to -0.19%. These are mechanical, rate-driven moves that improve the austin real estate calculus for income-focused buyers.
Context matters in any austin real estate market discussion. The last positive reading on the spread was August 2022 at roughly +0.01%. From there, the market endured a long negative stretch as policy rates climbed and T-Bill yields surged, compressing real estate’s current-income advantage. The nadir arrived in April 2024 at -2.15%, a level consistent with the investor pullback you observed. The climb from that trough to today’s near-flat level is significant in both absolute and behavioral terms. When the spread pushes toward +1%, your historical experience is that investors begin deploying capital more broadly; at -0.19% today, the austin market forecast is still below that trigger but clearly headed in the right direction.
Granular submarket data strengthens the austin real estate report. Twenty-two ZIP codes now exceed the “desired” cap-rate line of 3.890%, which mirrors today’s 6-month T-Bill yield. Those “over the line” submarkets include urban east and southeast neighborhoods such as 78725 (6.43%), 78724 (4.16%), 78741 (4.21%), 78747 (4.18%), 78753 (4.09%), and 78754 (4.55%). They also include close-in and first-ring suburbs like 78634 Hutto (3.98%), 78665 Round Rock (4.05), 78664 Round Rock (3.95), and 78652 Manchaca (3.99%). Farther out, value pockets extend through 78610 Buda (4.41), 78640 Kyle (4.48), 78666 San Marcos (4.04), 78612 Cedar Creek (4.11), 78621 Elgin (4.30), 78654 Marble Falls (4.16), 78616 Dale (4.39), 78644 Lockhart (4.57), and 78602 Bastrop (3.91), with 76574 Taylor sitting at roughly 3.89% on the line. These are the areas where current income meets or exceeds the short-bill alternative, giving data-led investors clear places to start underwriting.
For an objective austin housing market update, it helps to separate the market-wide average from the opportunity set. The all-market cap rate at 3.77% is still shy of the 3.96% T-Bill, which explains why some investors remain selective. But the presence of 22 ZIPs above the desired threshold shows that selection works; the market is not uniformly priced, and yield is available where median prices, taxes, and expected maintenance costs align with achievable rents. That dispersion is typical late in tightening cycles and tends to expand as financing costs normalize and rent growth stabilizes on a neighborhood-by-neighborhood basis.
Peak-value context helps frame expectations for the austin property market. The long-run spread average of +2.61% says the “normal” state of the world favors real estate income over short-bill yields by a comfortable margin. Today’s sub-zero reading confirms we are not yet back to that equilibrium, but the YoY and MoM trend direction, combined with a widening map of ZIP codes clearing the T-Bill hurdle, supports a forward-looking austin market forecast in which investor activity migrates from inquiry to offers. As spreads grind higher toward your +1% re-entry marker, the relative-value case becomes simpler to communicate to clients and partners.
In short, the austin real estate trends are pivoting on rates and math rather than anecdotes. The cap-rate side of the equation is improving; the T-Bill side is easing; and the opportunity set is expanding in specific ZIPs where the cap rate already outruns cash equivalents. That combination is exactly what brings disciplined investors off the sidelines first, and it is consistent with what you are hearing now—more questions, more underwriting requests, and a measurable return of curiosity.
FAQ
Is Austin a good place to invest in real estate?
Based on current yield math, Austin presents selective opportunities. The all-market cap rate is 3.77% versus a 3.96% 6-month T-Bill, leaving a spread of -0.19%, but 22 ZIP codes already exceed the 3.890% “desired” line that mirrors today’s T-Bill yield. The spread has improved almost a full point year over year and is the closest to positive since August 2022, indicating an austin real estate market that is reopening to yield-driven capital where submarket numbers pencil.
Where to invest in Austin, Texas?
Start where cap rates currently beat or meet cash equivalents. Examples include 78725, 78724, 78741, 78747, 78753, and 78754 on the east and southeast side, plus 78634 Hutto, 78665 and 78664 Round Rock, 78610 Buda, 78640 Kyle, 78666 San Marcos, 78612 Cedar Creek, 78621 Elgin, 78654 Marble Falls, 78616 Dale, 78644 Lockhart, 78602 Bastrop, 78652 Manchaca, and 76574 Taylor at the threshold. These are the ZIPs above roughly 3.890% today.
What is the return when you invest in Austin?
Cap rate is the market’s current-income proxy. The area-wide cap rate is 3.77% as of September 2025, while the investor-friendly ZIP codes range from about 3.91% up to 6.43% in the highest-yielding tract cited above. The relevant comparison point is the 6-month T-Bill at 3.96%; your return decision hinges on whether the property’s cap rate clears that bar after realistic expenses.
Why did investors pause in 2024?
The cap-rate minus T-Bill spread fell to -2.15% in April 2024, meaning cash-equivalent yields materially exceeded rental yields. In that regime, a 6-month T-Bill offered a significantly higher return than typical Austin rentals, and many investors chose to wait.
What signals a broader investor re-entry?
Your internal benchmark is that investor activity typically resumes as the spread approaches +1%. Today’s -0.19% is not there yet, but it is the first near-neutral print since August 2022 and a major improvement from 2024’s lows. As more ZIP codes stay above the 3.890% “desired” line and the spread grinds higher, inquiries tend to convert to offers.