Georgetown, TX Buyers Are Snapping Up $700K–$750K Homes After Sellers Slashed Prices by $84,000
Something unusual is happening in Georgetown's luxury market. In a price tier where homes have been sitting and sellers have been forced to make painful concessions averaging $84,000, buyers are suddenly showing up. The $700,000 to $750,000 segment of the Georgetown, TX real estate market has posted one of the highest Activity Index readings in its price class — 32.1% — a signal that demand is quietly building in response to some of the steepest price reductions in the entire market. For buyers who have been watching and waiting, the data suggests the window of maximum leverage may already be opening.
Georgetown's Market by the Numbers: 1,034 Active Listings Across All Price Tiers
Georgetown's housing market currently carries 1,034 active listings spanning every price tier from under $150,000 to over $1.1 million. That level of inventory tells a nuanced story — not every segment behaves the same way, and the differences in absorption, pricing pressure, and buyer activity vary dramatically by price point. The data presented here covers inventory levels, pending sales, closed transactions over the past 90 days, activity index readings, months of inventory, and the depth of price reductions sellers have been forced to accept across 21 price tiers.
At the lower end of the market, competition remains fierce. The $200,000 to $250,000 range posts a 200% absorption ratio with just 0.50 months of inventory — essentially no supply and strong demand. The $250,000 to $300,000 tier carries a 45.1% Activity Index with 2.29 months of inventory, squarely in seller's market territory. Moving up the price ladder, conditions shift considerably. By the time you reach the $500,000 and above tiers, months of inventory begin climbing into the 6, 7, and even 12-month range, and price reduction rates escalate accordingly.
The $700K–$750K Tier: Where Buyers Are Responding to Steep Price Cuts
The $700,000 to $750,000 price range stands out across the Georgetown market for a compelling reason: it is the zone where seller pain and buyer opportunity have intersected most dramatically. There are currently 36 active listings in this tier alongside 17 pending contracts, producing an Activity Index of 32.1%. That pending-to-active ratio is notably higher than most of the surrounding luxury tiers — the $650,000 to $700,000 range sits at 20.8%, and the $750,000 to $800,000 range posts 27.8% — which signals that buyers are specifically gravitating toward this price band.
The reason is not difficult to identify. Half of all active listings in the $700,000 to $750,000 tier — exactly 50% — have already experienced a price reduction, with the median dollar cut coming in at $84,000. Expressed as a percentage, that is a median reduction of 10.23%. To put that in concrete terms: a seller who originally listed at $740,000 has likely already dropped to approximately $656,000 just to compete. These are not trivial adjustments. They represent sellers who have recalibrated expectations significantly, and buyers are beginning to take notice.
With 5.40 months of inventory, the $700,000 to $750,000 tier sits in neutral market territory — the zone between 4 and 6 months where neither buyers nor sellers hold a commanding advantage. Homes in this range are spending a median of 70 days on market before going under contract, which means buyers have time to conduct due diligence without the frenzied competition seen at lower price points. The 90-day closed sales count of 20 units confirms there is genuine transaction activity, not just listing accumulation.
Price Reduction Depth Across the Georgetown Market
To understand how the $700,000 to $750,000 tier compares, it helps to look at price reduction patterns across all price bands. The $700K–$750K tier's median cut of $84,000 and 10.23% reduction rate is the steepest percentage cut of any tier with meaningful inventory in the mid-to-upper price range. By comparison, the $300,000 to $350,000 tier — which has 112 active listings and is one of the most liquid segments in the market — shows a median cut of just $13,250, or 3.93%. Even the $550,000 to $600,000 range, which carries over 100 active listings and 6.72 months of inventory, posts an 8.01% median reduction.
The upper luxury segments tell a more cautious story. The $800,000 to $900,000 range carries 12.38 months of inventory in both tiers, firmly in buyer's market territory, yet the price cut percentages are more modest. The $850,000 to $900,000 tier posts a 5.85% median reduction despite a 10.8% Activity Index — sellers in that range have not yet moved aggressively enough to attract meaningful buyer response. The $1.1 million and above tier, with 14.10 months of inventory and a 7.1% absorption ratio, shows the deepest inventory overhang in the market but a relatively contained 3.98% median reduction, suggesting sellers in that bracket are holding firm even as inventory accumulates.
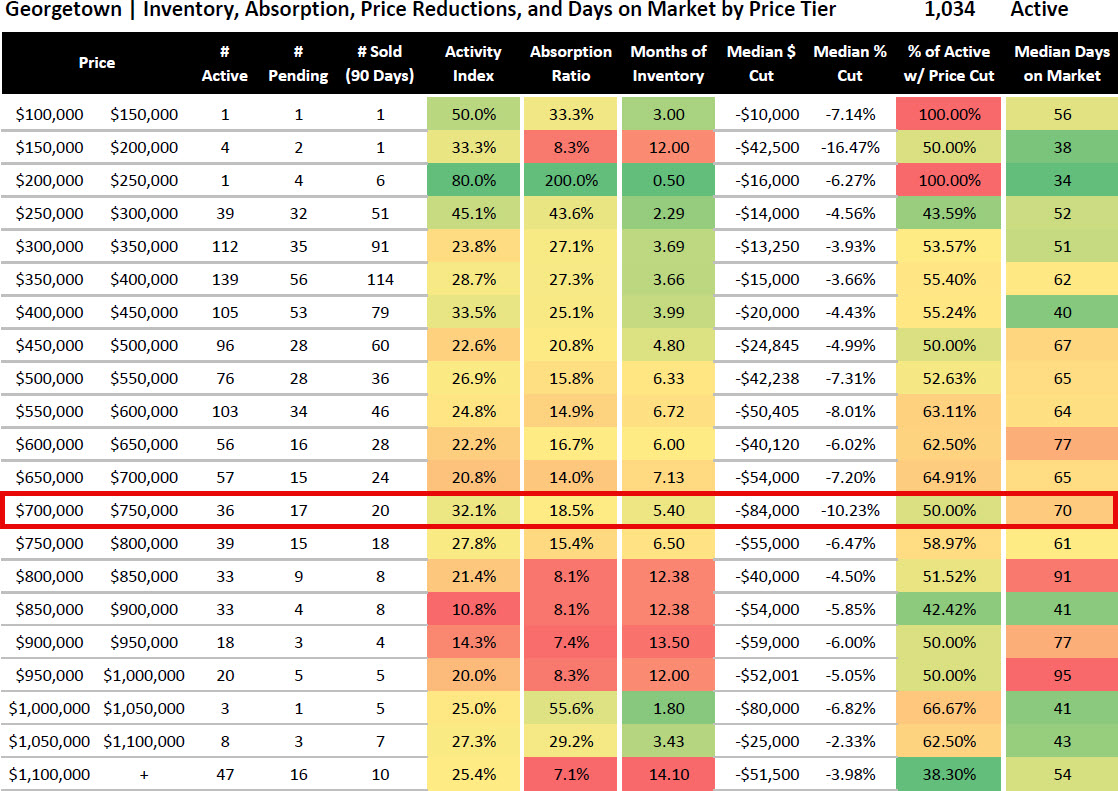
Georgetown Real Estate Market Data: Full Price Tier Breakdown
The table below presents the complete inventory, absorption, price reduction, and days-on-market breakdown for all 21 price tiers currently tracked in the Georgetown, TX housing market. The highlighted row represents the $700,000 to $750,000 tier discussed throughout this analysis.
Note: Highlighted row indicates the $700,000–$750,000 price tier. Activity Index = Pending / (Active + Pending). Neutral market defined as 4–6 months of inventory. Buyer's market defined as 7+ months of inventory.
What This Means for Buyers in Georgetown
For buyers targeting the $700,000 to $750,000 price range in Georgetown, the current data presents a meaningful opportunity. Sellers in this tier have already demonstrated willingness to cut — and cut substantially. The $84,000 median reduction means the market has effectively repriced itself, and the rising Activity Index suggests that other buyers have taken note. While 5.40 months of inventory still reflects a balanced market where buyers carry real negotiating power, the 32.1% Activity Index is a leading indicator worth watching. If pending conversions continue at the current pace, absorption will improve and the window for maximum leverage could narrow.
Buyers should also note that 70 days on market provides adequate time for inspection, financing, and negotiation without urgency-driven mistakes. With 50% of active listings already carrying price reductions, it is reasonable to expect that sellers who have not yet cut are aware of the competitive pressure around them. Buyers who are pre-approved and prepared to move can enter negotiations from a position of informed strength.
What This Means for Sellers in Georgetown
Sellers currently listed in the $700,000 to $750,000 range who have not yet reduced face a challenging competitive environment. Half the field has already taken significant cuts, and those properties are the ones generating pending contracts. The 70-day median days on market is a reflection of what happens when pricing adjustments meet buyer interest — properties that have been repositioned are moving. Sellers who remain at original list prices may find themselves watching comps go pending around them while their own listings age.
For sellers in the tiers above $750,000, particularly those in the $800,000 to $900,000 range with 12+ months of inventory, the data is a more sobering signal. Activity Index readings in the 10% to 21% range combined with double-digit months of inventory indicate that buyer demand at those price points has not yet caught up to supply, even after moderate price adjustments. Sellers in those tiers may need to evaluate whether their current pricing strategy reflects market reality or original purchase-price anchoring.
Frequently Asked Questions
Is Georgetown, TX a buyer's market or seller's market right now?
Georgetown's market is highly segmented by price tier, making a single blanket characterization misleading. At price points below $450,000, months of inventory remain under 5 months and Activity Index readings exceed 22%, reflecting seller-favorable conditions. Above $650,000, most tiers carry 6 or more months of inventory, with several luxury segments exceeding 12 months — firmly in buyer's market territory. The $700,000 to $750,000 tier is an exception, sitting at 5.40 months of inventory in neutral territory while posting a 32.1% Activity Index, suggesting buyers are responding actively to price reductions in that range.
Why are home prices being reduced so much in Georgetown's $700K–$750K range?
The $700,000 to $750,000 segment accumulated inventory during the period of peak Austin-area pricing, when many homes in this range were listed at aspirational values that the current rate environment and buyer pool have not supported. With 36 active listings competing for a relatively thin buyer pool, sellers have been forced to reprice aggressively to generate interest. The median cut of $84,000 — a 10.23% reduction — reflects the gap between original list prices and where motivated buyers are actually willing to transact. The fact that 50% of active listings have already taken cuts indicates that sellers who tested the market at higher prices have now adjusted course.
How does the Activity Index work and what does 32.1% mean for Georgetown?
The Activity Index is calculated by dividing pending sales by the total of active plus pending listings, expressed as a percentage. A reading of 32.1% in the $700,000 to $750,000 tier means that for every 53 total listings in the active-plus-pending pool, 17 are already under contract. In the context of Georgetown's broader market, this is one of the stronger Activity Index readings in the upper price tiers, most of which register between 10% and 28%. It indicates that buyers are engaging with this price range at a meaningfully higher rate than adjacent luxury segments, likely driven by the perception that significant price reductions represent genuine value.
What is a good months of inventory reading in the Georgetown real estate market?
In the Georgetown, TX real estate market, months of inventory under 4 months generally indicates a seller's market with upward pricing pressure and competitive buyer conditions. Between 4 and 6 months is considered neutral, where neither buyers nor sellers hold a dominant advantage and prices tend to remain stable. At 7 months or more, the market shifts in favor of buyers, who gain negotiating power on price, concessions, and terms. The Georgetown market currently spans all three zones simultaneously depending on price tier, ranging from 0.50 months at the $200,000 to $250,000 level all the way to 14.10 months for properties above $1.1 million.
Should I buy a home in Georgetown, TX right now?
The answer depends heavily on your target price range and financial readiness. In price tiers below $450,000, Georgetown remains a competitive market where well-priced homes move quickly and buyer leverage is limited. In the $700,000 to $750,000 range specifically, current conditions are favorable for prepared buyers — sellers have already accepted significant reductions, the Activity Index is rising, and the neutral inventory level still provides negotiating room. In the $800,000 to $1 million range, buyers have even greater leverage with 12+ months of inventory, though the pace of transactions is slower. For any buyer, working with data-informed representation that understands price-tier dynamics is essential in a market this segmented.