City of Austin Price Drops, Inventory Pressure, and Shifting Buyer Behavior
Published | Posted by Dan Price
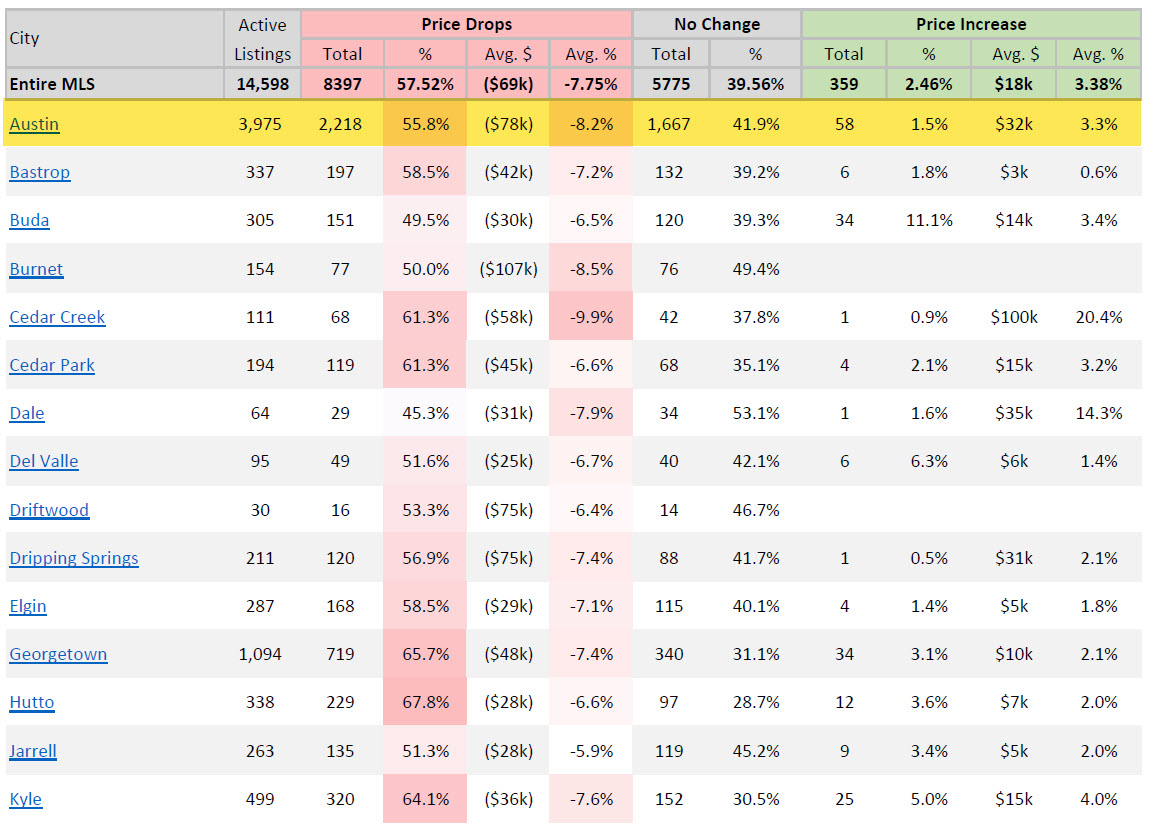
The Austin housing market continues to reset as more than half of all active listings in the city are posting price reductions, signaling a decisive shift in seller behavior and illustrating how the Austin real estate market is adapting to prolonged inventory pressure and selective buyer activity.
Austin remains one of the most closely watched housing markets in Texas, and today’s data gives a clear view of how pricing, inventory, and buyer expectations are reshaping the landscape. With 3,975 active listings across the city, inventory is well above the levels seen during the 2020–2022 boom years. The higher supply is giving buyers more options, slowing absorption, and forcing sellers to adjust their pricing earlier and more aggressively in the listing cycle. This trend defines the current Austin housing environment and sets the tone for how negotiations unfold across the city.
One of the strongest indicators of market softness is the rate of price reductions. In the City of Austin, 2,218 out of 3,975 active listings have already dropped their price, representing 55.8 percent of the entire market. The average reduction is seventy-eight thousand dollars, or 8.2 percent, before the home goes under contract. That level of repricing highlights a disconnect between initial list prices and actual buyer demand, revealing a market where sellers are chasing the true value after testing higher starting points. By comparison, across the broader Austin-area MLS, the average price drop is 7.75 percent, which means the City of Austin is experiencing deeper adjustments than the surrounding region.
Price-cut behavior becomes even more revealing when broken down by ZIP code within Austin. Several ZIP codes are seeing average price drops exceeding 10 percent. ZIP code 78721 shows the steepest average decline at 10.7 percent, signaling meaningful pressure in that submarket. ZIP codes 78722 and 78756 are also seeing double-digit reductions, posting average drops of 10.4 percent and 10.0 percent, while 78752 stands out with one of the largest adjustments at 12.0 percent. When price drops exceed the citywide average by several percentage points, it confirms that buyers in those neighborhoods are either more price-sensitive or have more inventory to choose from, which weakens seller leverage. These ZIP-level signals help explain the broader market trend: pricing is no longer moving upward by default, and list-to-sale spreads are widening in areas where inventory accumulates more quickly.
The months-of-inventory metric for the City of Austin sits at 4.72 months, placing the city in a borderline neutral environment. At this level, the market leans away from the high-velocity conditions of recent years and toward a more balanced posture where buyers have time to compare properties. While Austin is not yet in a full buyer’s market by months-of-inventory standards, the price-drop data indicates that buyers are behaving as if they have the advantage, and sellers are responding accordingly. Homes that linger on the market for several weeks without competitive interest are adjusting to more realistic pricing, and ZIP code–level data shows that days on market are extending in areas where inventory is most concentrated.
Looking across the city’s pricing landscape, the disconnect between average list prices and median prices underscores the pressure on higher-priced segments. Austin’s average list price is nine hundred twenty-two thousand dollars, while the median sits at five hundred fifty-nine thousand nine hundred dollars. This gap highlights how upper-tier inventory continues to accumulate, pulling the average upward while the median better reflects the price bracket where most demand exists. With deeper price drops occurring in several mid-market ZIP codes, it shows that buyers are not only resisting top-tier pricing but are also pushing back in more affordable neighborhoods.
In this environment, buyer psychology plays a major role. High inventory gives buyers the confidence to negotiate aggressively, wait out overpriced listings, and demand value. Sellers, meanwhile, are adapting to the reality that aspirational pricing does not survive long in the current Austin real estate market. The data shows that waiting does not usually translate into higher offers; instead, listings that begin too high ultimately end up reducing by larger percentages than homes priced realistically from day one. This trend reinforces how buyers interpret market signals closely, especially when over half of the active inventory is publicly showing price cuts.
Looking ahead, the ongoing normalization in Austin is shaping the conditions of the coming year. As long as inventory remains elevated and buyers have ample choices, price reductions are likely to stay a prominent feature of the Austin housing market. The ZIP-code-level patterns show where the most pressure points exist, and the broader citywide averages confirm that sellers must remain flexible and data-driven. The Austin real estate forecast continues to favor cautious buyers and motivated sellers, with the next phase of the cycle dependent on whether demand accelerates or inventory continues to build. The market is adjusting, not collapsing, but the downward pricing pressure is real and measurable across every neighborhood.
FAQ Section
What is driving price drops in the Austin housing market?
Price drops in Austin are primarily driven by elevated inventory levels and selective buyer behavior. With nearly 4,000 active listings and more than half undergoing price reductions, sellers are responding to slower absorption and increased competition. Buyers have more leverage and more time to compare properties, which forces initial list prices to adjust downward. This dynamic is now consistent across multiple ZIP codes within the city.
Are certain parts of Austin seeing deeper price drops than others?
Yes. Several ZIP codes within Austin show average price drops exceeding 10 percent, including 78721, 78722, 78752, and 78756. These areas demonstrate some of the strongest downward pricing pressure in the city. This pattern suggests pockets of oversupply, weaker demand relative to inventory, and price sensitivity among buyers within those neighborhoods.
Is Austin currently a buyer’s market or a seller’s market?
Austin sits near the neutral range with 4.72 months of inventory, but buyer behavior resembles a buyer-leaning environment. Price-drop rates above 55 percent and significant reductions in several ZIP codes signal that buyers hold meaningful negotiation power. Sellers can still succeed, but pricing must align with current market reality.
How does the City of Austin compare to the broader regional Austin MLS?
Across the entire Austin-area MLS, the average price reduction is 7.75 percent. Within Austin city limits, the average is 8.2 percent, meaning the city is correcting slightly faster than the surrounding region. This pattern reflects deeper price resistance within the core urban market, where inventory and new listing flow remain high.
What does this mean for the Austin real estate forecast?
The Austin real estate forecast remains stable but price-sensitive. As long as inventory stays high and buyers continue prioritizing value, prices will adjust to meet demand. The underlying fundamentals remain solid, but the city is moving through a normalization phase where pricing must remain grounded in data rather than expectations tied to pandemic-era market conditions.