Analyzing Austin’s Real Estate Market: Price per Square Foot Trends by Zip Code in April 2025
The Austin-area real estate market in April 2025 offers a detailed snapshot of home price trends through a comprehensive dataset on price per square foot across 75 zip codes. Compiled by Team Price Real Estate, this data, last revised on April 29, 2025, tracks active, pending, and sold (past 90 days) median prices per square foot, alongside a unique metric called "Pending < Sold." This metric compares the median pending price per square foot, adjusted by the sold-to-list price ratio, to the median sold price per square foot from recent sales. A negative "Pending < Sold" value indicates that pending sales are lower than recent sold prices, suggesting potential price declines, while a positive value points to possible price increases. With 38 of 75 zip codes (50.7%) showing negative values, the market presents a mix of opportunities and challenges for buyers and sellers.
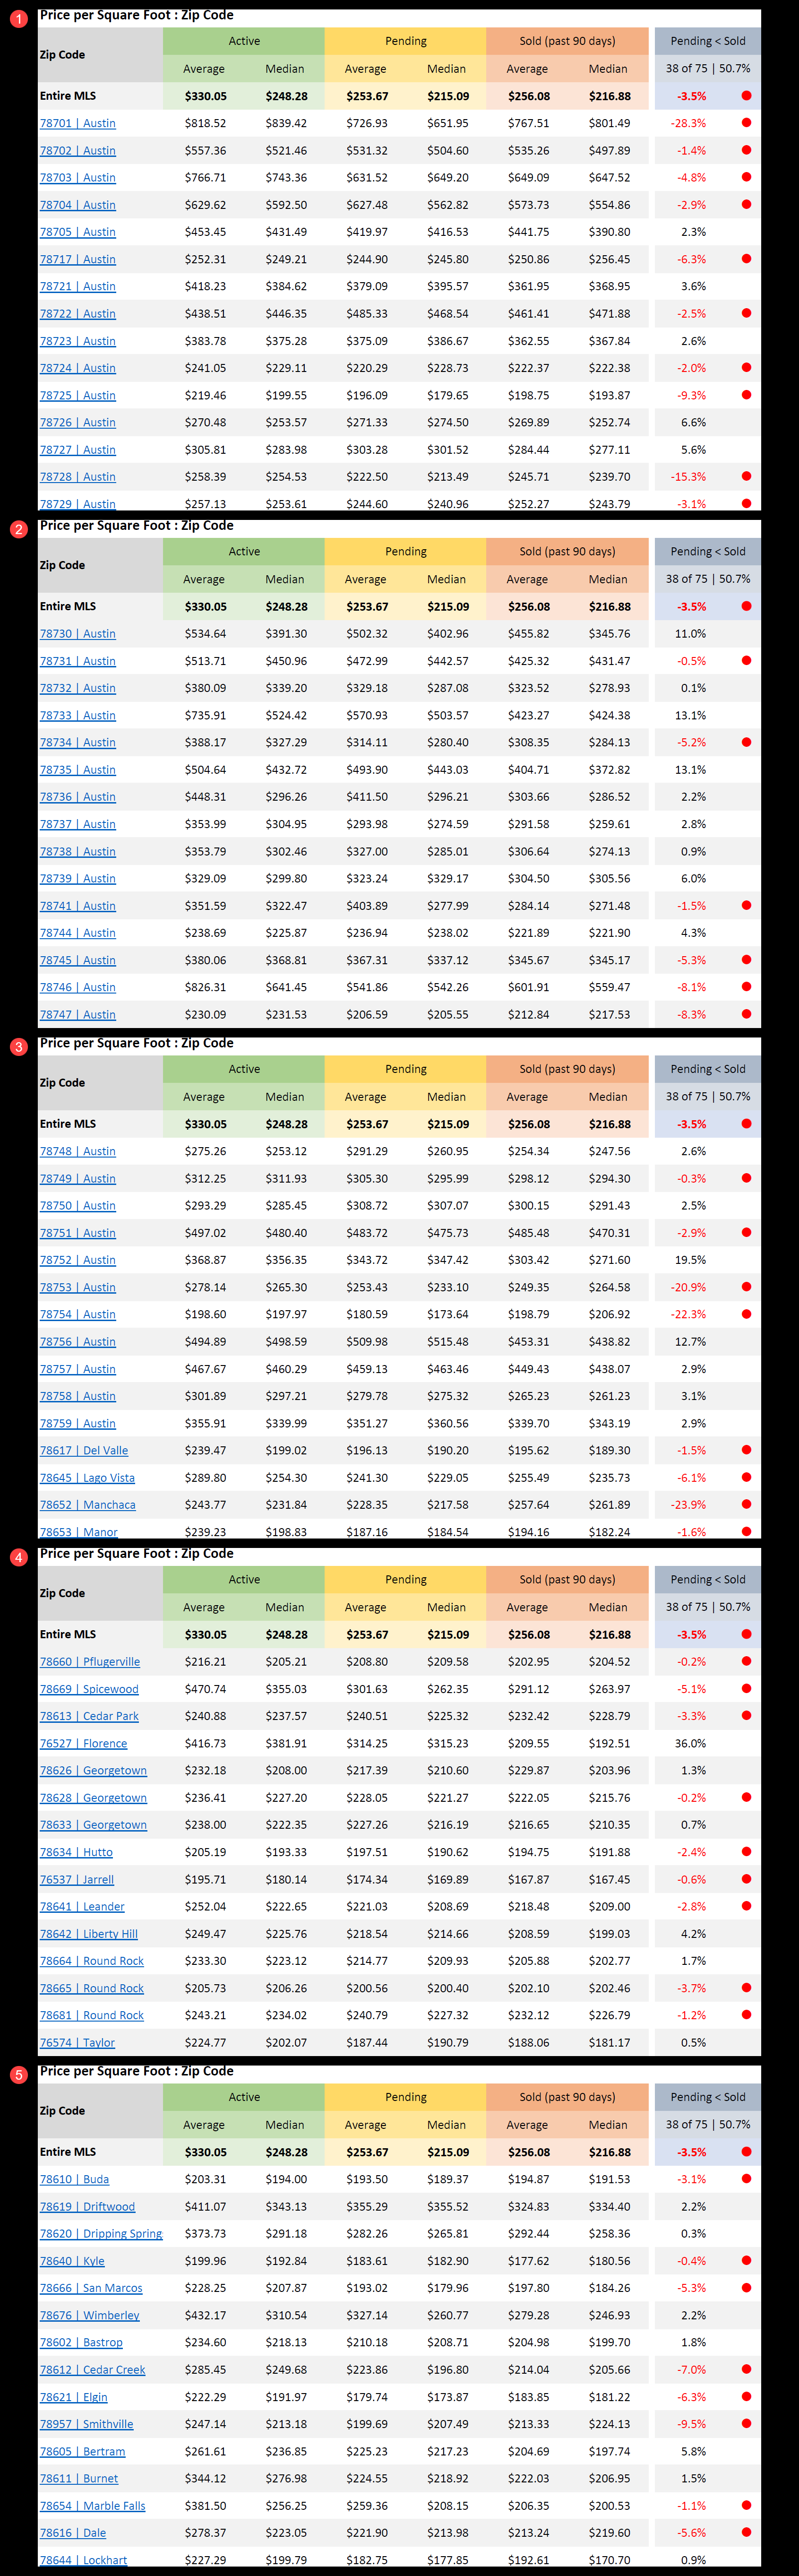
Across the entire Multiple Listing Service (MLS), the median active price per square foot stands at $248.28, while the pending median is $215.09, and the sold median is $216.88. The "Pending < Sold" value for the entire MLS is -3.5%, indicating a slight downward pressure on prices region-wide. This suggests that homes under contract are likely to close at prices slightly below those seen in the past 90 days. However, the data reveals significant variation across zip codes, with some areas showing sharp declines and others indicating robust growth. For example, downtown Austin’s 78701 zip code has a median active price of $839.42, a pending median of $651.95, and a sold median of $801.49, resulting in a "Pending < Sold" value of -28.3%. This substantial negative value highlights a significant gap between pending and sold prices, pointing to a potential cooling in this high-end market.
In contrast, rural areas like Florence’s 76527 zip code show strong growth. Here, the median active price is $381.91, the pending median is $315.23, and the sold median is $192.51, leading to a "Pending < Sold" value of 36.0%. This suggests that homes under contract are priced much higher than recent sales, indicating a surge in demand or new, higher-value properties entering the market. Similarly, central Austin’s 78752 zip code, with a pending median of $347.42 and a sold median of $271.60, has a "Pending < Sold" value of 19.5%, reflecting strong price appreciation in this relatively affordable area near Mueller.
Other zip codes with notable declines include Manchaca’s 78652, where the median active price is $231.84, the pending median is $217.58, and the sold median is $261.89, resulting in a "Pending < Sold" value of -23.9%. Northeast Austin’s 78754 follows closely with a -22.3% value, driven by a pending median of $173.64 compared to a sold median of $206.92. These areas, often more affordable, may be seeing buyer resistance to recent price levels or increased inventory pushing prices down. Meanwhile, suburban zip codes like 78733 and 78735, both with "Pending < Sold" values of 13.1%, show pending medians of $503.57 and $443.03, respectively, compared to sold medians of $424.38 and $372.82, indicating sustained demand for high-end suburban homes.
The dataset also highlights stable markets, with 41 of the 75 zip codes showing "Pending < Sold" values between -5% and 5%. For instance, 78705 in Austin has a pending median of $416.53, a sold median of $390.80, and a "Pending < Sold" value of 2.3%, suggesting steady pricing. Similarly, 78748, with a pending median of $260.95 and a sold median of $247.56, has a 2.6% value, indicating minimal price movement. These stable zip codes, which make up the majority, reflect a balanced market where pending and sold prices are closely aligned.
Affordable suburbs like Pflugerville’s 78660, with a pending median of $209.58 and a sold median of $204.52, show a near-neutral "Pending < Sold" value of -0.2%, indicating stability in this price-sensitive market. In contrast, high-end areas like 78746 (Westlake) have a pending median of $542.26, a sold median of $559.47, and a "Pending < Sold" value of -8.1%, suggesting a slight softening in this luxury market. Rural zip codes like Bertram’s 78605, with a pending median of $217.23 and a sold median of $197.74, show a positive 5.8% value, reflecting moderate growth.
The variation in price per square foot across zip codes underscores the segmented nature of the Austin-area market. For example, the lowest sold median price is in Jarrell’s 76537 at $167.45, while the highest is in 78701 at $801.49. This range highlights the diversity of housing options, from affordable suburban and rural homes to luxury urban properties. The "Pending < Sold" metric provides a forward-looking lens, showing that while some areas face potential price declines, others are poised for growth. For instance, 78730, with a pending median of $402.96 and a sold median of $345.76, has an 11.0% "Pending < Sold" value, signaling price increases in this northwest Austin suburb.
The data also reveals patterns in negotiation dynamics. In zip codes with large negative "Pending < Sold" values, such as 78701 (-28.3%) or 78652 (-23.9%), buyers may be negotiating aggressively, or sellers are accepting lower offers to move properties. Conversely, in areas like 76527 (36.0%) or 78752 (19.5%), pending prices suggest strong buyer demand, with homes likely selling close to or above list prices. This contrast highlights the importance of zip-code-level analysis for understanding local market conditions.
Overall, the April 2025 data from Team Price Real Estate paints a complex picture of the Austin-area real estate market. With a region-wide "Pending < Sold" value of -3.5% and 38 of 75 zip codes showing negative values, there is slight downward pressure on prices overall. However, significant variation exists, with zip codes like 78701 and 78652 indicating potential declines, while 76527 and 78752 suggest robust growth. Stable markets dominate, with 41 zip codes showing minimal price movement. This detailed dataset equips buyers, sellers, and investors with the insights needed to navigate the diverse Austin-area housing market.
FAQ Section
What does the "Pending < Sold" metric mean in Austin’s real estate market?
The "Pending < Sold" metric compares the median pending price per square foot, adjusted by the sold-to-list price ratio, to the median sold price per square foot from the past 90 days. A negative value, like -28.3% in 78701, suggests pending sales are lower than recent sold prices, indicating potential price declines. A positive value, like 36.0% in 76527, points to higher pending prices, suggesting potential price increases. In April 2025, 38 of 75 zip codes had negative values, showing a mixed market.
Which Austin zip codes have the highest and lowest price per square foot in 2025?
In April 2025, the highest sold median price per square foot is in 78701 (downtown Austin) at $801.49, reflecting its luxury market. The lowest is in 76537 (Jarrell) at $167.45, indicating affordability in this suburban area. Active and pending prices also vary, with 78701 at $839.42 (active) and $651.95 (pending), and 76537 at $180.14 (active) and $169.89 (pending).
How are home prices trending in Austin’s suburbs in April 2025?
Austin’s suburban zip codes show varied trends in April 2025. Affordable suburbs like 78660 (Pflugerville) have a sold median of $204.52 and a "Pending < Sold" value of -0.2%, indicating stability. High-end suburbs like 78733 and 78735 have sold medians of $424.38 and $372.82, respectively, with 13.1% "Pending < Sold" values, suggesting price growth. However, areas like 78652 (Manchaca) show a -23.9% value, pointing to potential declines.