Not Every Austin Neighborhood Is the Same Market — Your Zip Code Changes Everything
Published: March 2026 | Data through February 2026 | Team Price Real Estate
Two buyers can sit down at the same kitchen table in Austin, Texas and walk away with completely different outcomes — one facing a bidding war, the other negotiating a seller down by tens of thousands of dollars. That isn't luck. It's the direct result of which zip code they're shopping in. The Austin real estate market as a whole carries 4.76 months of inventory right now, a figure that sits right on the edge of the neutral zone — but that single number masks a dramatic range of conditions playing out across the region simultaneously.
Understanding where any given neighborhood falls on that spectrum is the most important piece of analysis a buyer or seller can do before making a move. Across 30 cities and 75 zip codes tracked in the Austin property market, inventory levels range from a staggering 21.33 months in Dale (zip 78616) down to just 1.60 months in Southwest Austin's 78739. That gap isn't a footnote — it defines what strategy, pricing, and expectations should look like for every transaction in every corner of the market.
How Months of Inventory Defines the Austin Housing Market
Months of inventory is one of the most reliable indicators in real estate analysis. It measures how long it would take to sell all active listings at the current pace of sales, assuming no new listings hit the market. Historically, a balanced market — one where neither buyers nor sellers hold a clear advantage — sits between 5.0 and 6.9 months. Below that threshold, supply tightens, sellers gain leverage, and prices trend upward. Above it, buyers gain room to negotiate, and sellers often face longer days on market and price reductions.
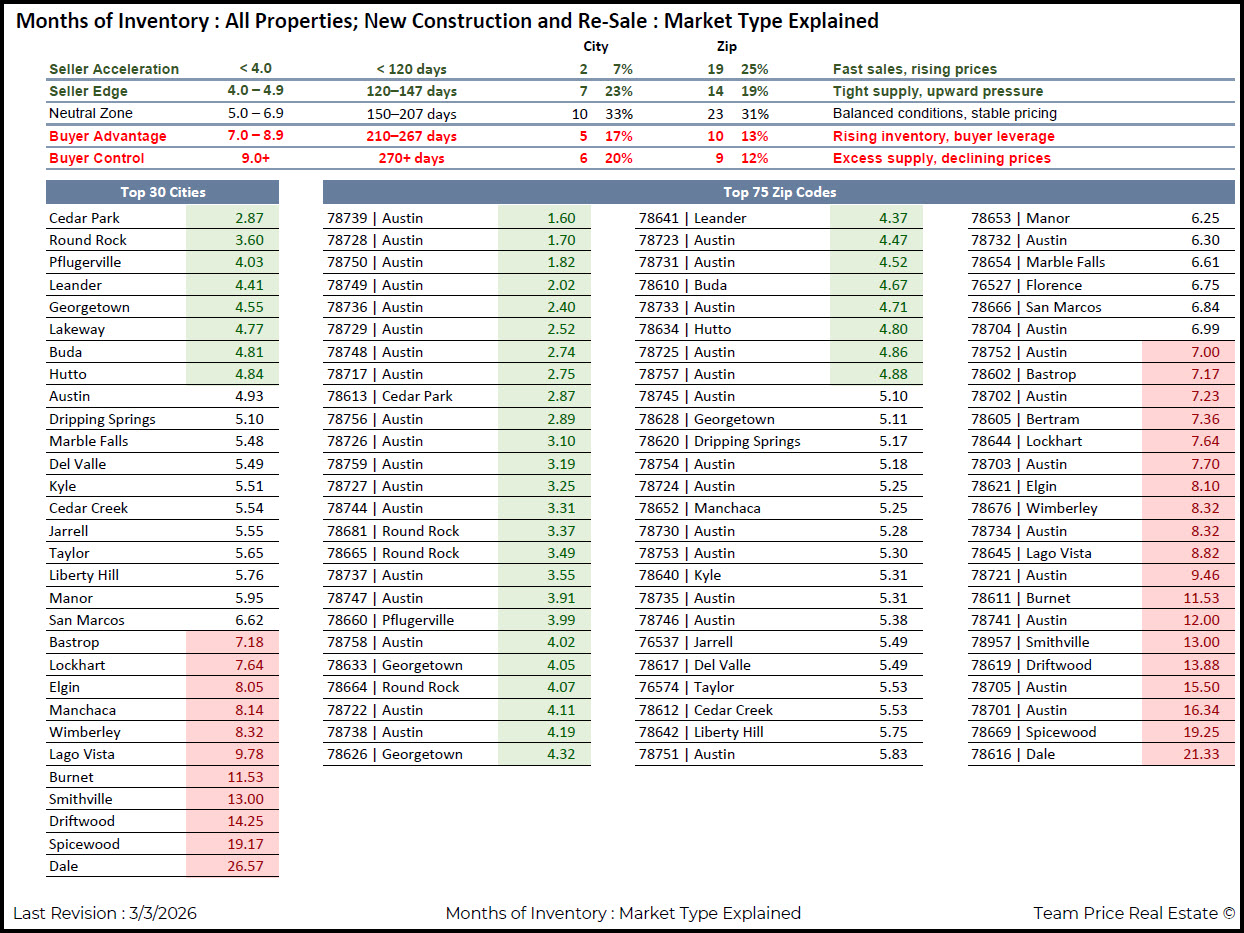
The Austin housing market framework used to track conditions across the region breaks the spectrum into five distinct zones. Below 120 days (under 4.0 months) represents Seller Acceleration — fast sales and rising prices. The Seller Edge zone sits between 120 and 147 days, where tight supply creates upward pressure. The Neutral Zone runs from 150 to 207 days, reflecting stable, balanced conditions. The Buyer Advantage zone, between 210 and 267 days, marks rising inventory and growing buyer leverage. At 270 days or more, the market enters Buyer Control — excess supply and declining prices. With 4.76 months of inventory region-wide, greater Austin sits between Seller Edge and Neutral, but that headline figure only tells part of the story.
The Tightest Austin Real Estate Markets: Where Sellers Still Hold All the Cards
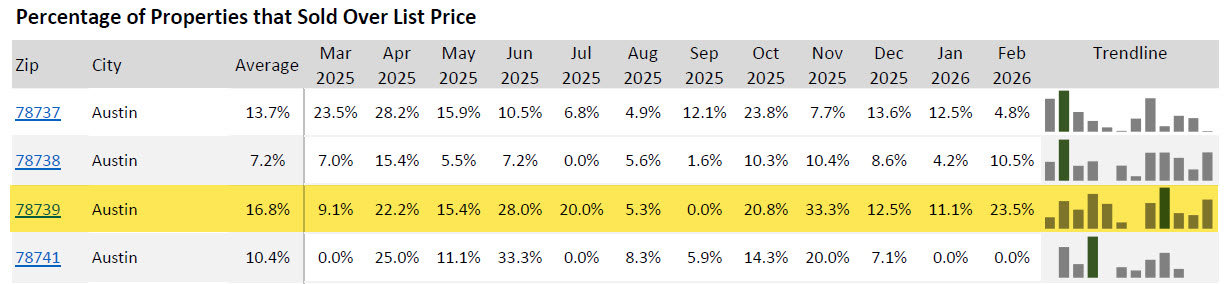
At the compressed end of the Austin real estate market, a handful of zip codes are operating under full seller acceleration. Zip code 78739 in Southwest Austin leads the region with just 1.60 months of inventory — a number so low that buyers should expect competition, speed, and premium pricing on almost every listing. The data backs that up. In February 2026, 23.5% of homes sold in 78739 closed above their list price. Looking back across the prior 12 months, 16.8% of all closed sales in that zip code exceeded list price, making over-list-price sales a consistent pattern rather than an occasional anomaly.
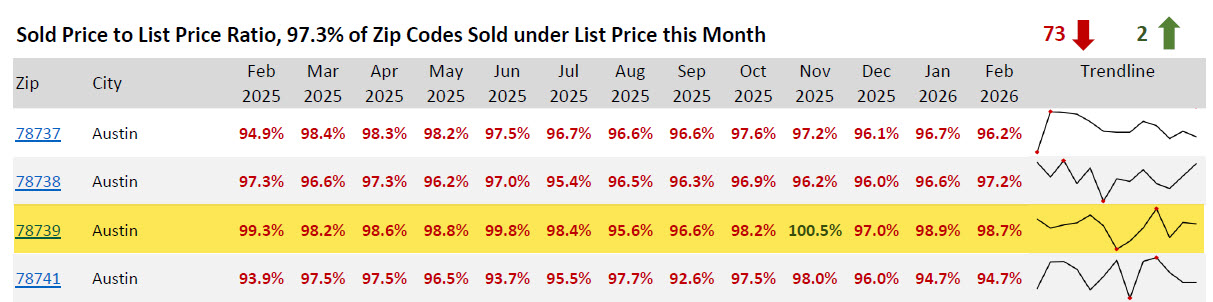
The sold-to-list price ratio for February 2026 came in at 98.7%, which reflects strong pricing discipline by sellers and limited room for buyers to negotiate. At its peak in November 2025, that ratio reached 100.5% — meaning the average home sold above asking price. Even as conditions have settled slightly from that peak, the 78739 zip code remains firmly in seller territory. Other tight markets in the region include 78728 in Austin at 1.70 months, 78750 in Austin at 1.82 months, 78749 in Austin at 2.02 months, and 78736 in Austin at 2.40 months. Cedar Park's 78613 sits at 2.87 months, keeping it in the Seller Acceleration zone as well.
These sub-4.0-month markets share common characteristics: homes move quickly, price cuts are rare, and buyers who aren't prepared to act decisively — and sometimes above list — are likely to lose out repeatedly. In February 2026, 11.0% of all homes sold region-wide closed above list price, a figure that is heavily weighted by the performance of these compressed markets.
The Other End of the Spectrum: Austin Real Estate Trends in Buyer-Controlled Markets
While buyers in 78739 are competing against multiple offers, buyers in other parts of the greater Austin market are sitting in an entirely different position. Dale, Texas (78616) carries 21.33 months of inventory — a level that places it deep inside Buyer Control territory. Spicewood (78669) follows at 19.25 months, Austin's 78701 zip code at 16.34 months, and 78705 in Austin at 15.50 months. Smithville (78957) sits at 13.00 months, while Burnet (78611) carries 11.53 months.
In these markets, sellers face a fundamentally different reality. Excess supply means homes sit longer, buyers have time to negotiate, and price reductions become a standard tool rather than a last resort. A seller who prices aggressively or fails to prepare their home competitively risks watching their listing age on the market while buyers exercise patience and leverage. For buyers in these areas, the advantage is real and measurable — they have room to negotiate on price, request concessions, and take the time to conduct thorough due diligence without fear of losing a home to a competing offer.
Mid-range cities tell a more nuanced story. Bastrop sits at 7.18 months of inventory, San Marcos at 6.62, and Kyle at 5.51, all placing them in or near the upper edge of the Neutral Zone. Round Rock at 3.60, Cedar Park at 2.87, and Pflugerville at 4.03 lean toward seller-friendly conditions. Georgetown checks in at 4.55, Leander at 4.41, and Buda at 4.81 — all within or near the Neutral Zone but trending toward balance or slight seller advantage depending on the specific price range and property type.
What This Means for Buyers and Sellers in the Austin Housing Market
The practical implications of this data are significant for anyone preparing to buy or sell in the Austin housing market in 2026. For buyers, knowing the inventory level of their target area before writing an offer is not optional — it is the foundation of an effective strategy. A buyer targeting a home in 78739 needs to come in with strong financing pre-approval, minimal contingencies where legally appropriate, and a competitive offer price from the start. Wasting time with low-ball offers in a 1.60-month market is a reliable path to frustration. Conversely, a buyer targeting the Bastrop or San Marcos area has genuine negotiating room and should be using market data to support a more deliberate approach.
For sellers, the implications cut equally deep. A seller in 78739 in the right price range can still price confidently, minimize concessions, and expect a relatively fast transaction — particularly if their home is well-presented. A seller in a market carrying 7 or more months of inventory needs to approach pricing differently, understand that buyers will negotiate, and plan for a longer marketing period. Pricing to the market from day one — rather than pricing high and cutting later — is consistently the more effective strategy in softer inventory conditions.
The regional average of 4.76 months is a useful reference point, but it cannot replace zip-code-level analysis. Two sellers in the same city can face radically different conditions depending on their neighborhood, price band, and property type. The Austin real estate forecast for 2026 points to continued divergence between high-demand, supply-constrained zip codes and areas where new construction or less employment-driven demand has softened conditions. That divergence is not a temporary anomaly — it reflects the structural geography of the Austin market and is likely to persist.
Reading the Full Austin Real Estate Report: City-by-City Inventory Snapshot
Across the 30 cities tracked in the Austin housing market update, the data reveals a clear geographic pattern. Urban core zip codes in Austin with strong walkability, job access, and limited new construction tend to carry the tightest inventory. Suburban markets closer to employment centers — Cedar Park, Round Rock, Leander — sit in the moderate range. More distant suburban and exurban markets, including those east and southeast of the urban core, carry the heaviest inventory loads.
Among the tightest city-level markets in greater Austin: Cedar Park at 2.87 months, Round Rock at 3.60, Pflugerville at 4.03, Leander at 4.41, Georgetown at 4.55, Lakeway at 4.77, Buda at 4.81, Hutto at 4.84, and Austin overall at 4.93. Moving into heavier inventory, Dripping Springs sits at 5.10, Marble Falls at 5.48, Del Valle at 5.49, Kyle at 5.51, Cedar Creek at 5.54, Jarrell at 5.55, Taylor at 5.65, Liberty Hill at 5.76, Manor at 5.95, San Marcos at 6.62, and Bastrop at 7.18. At the high end: Lockhart at 7.64, Elgin at 8.05, Manchaca at 8.14, Wimberley at 8.32, Lago Vista at 9.78, Burnet at 11.53, Smithville at 13.00, Driftwood at 14.25, Spicewood at 19.17, and Dale at 26.57.
These figures, current as of early March 2026, represent a detailed snapshot of the Austin property market that goes well beyond what regional averages can show. For anyone making a buying or selling decision in the greater Austin area, this zip-code and city-level data is the most precise tool available for setting realistic expectations and building an effective strategy.
Frequently Asked Questions
What does months of inventory mean in the Austin real estate market?
Months of inventory measures how long it would take to sell all currently listed homes at the existing pace of sales, assuming no new homes are added to the market. In the Austin housing market, a reading below 4.0 months indicates strong seller conditions, with fast sales and upward price pressure. Between 5.0 and 6.9 months is generally considered balanced. Above 7.0 months, buyers gain leverage and sellers face longer marketing times. The Austin market currently carries 4.76 months of inventory overall, but individual zip codes range from 1.60 to over 21 months, making local analysis essential.
Is the Austin housing market a buyer's or seller's market in 2026?
The answer depends entirely on where you are looking in greater Austin. At 4.76 months of inventory region-wide, the overall Austin real estate market sits near the lower boundary of the neutral zone — which favors sellers slightly. However, individual zip codes tell very different stories. Areas like 78739 in Southwest Austin, with 1.60 months of inventory and 23.5% of February 2026 sales closing above list price, are firmly seller's markets. Areas like Dale (78616) at 21.33 months of inventory and parts of downtown Austin with 15+ months are solidly buyer's markets. The Austin housing market in 2026 is best described as a tale of two markets depending on location.
What percentage of Austin homes are selling above list price?
In February 2026, 11.0% of homes across the greater Austin real estate market sold above their list price. That figure varies significantly at the zip-code level. In 78739, one of the tightest markets in the region, 23.5% of February 2026 sales closed above list price. Over the prior 12-month period, 16.8% of all solds in that zip code exceeded list price, indicating that above-list sales are a recurring feature of that market rather than an occasional spike. The sold-to-list price ratio in 78739 reached a peak of 100.5% in November 2025 before settling to 98.7% in February 2026 — still well above the regional average.
Which Austin suburbs have the most favorable conditions for buyers right now?
Based on current Austin real estate data, buyers will find the most favorable negotiating conditions in markets with the highest months of inventory. Dale (78616) leads at 21.33 months, followed by Spicewood at 19.17 months, parts of Downtown Austin (78701) at 16.34 months, and the University of Texas area (78705) at 15.50 months. Among cities, Bastrop carries 7.18 months, Lockhart 7.64, Elgin 8.05, and Lago Vista 9.78. In these markets, buyers have more time to make decisions, more room to negotiate on price and concessions, and less risk of losing homes to competing offers. The Austin real estate trends in these areas currently favor buyer leverage in a way not seen in the tighter urban zip codes.
How should sellers price their home given the current Austin market conditions?
Pricing strategy in the Austin housing market in 2026 must be tied directly to local inventory data rather than regional averages. A seller in a zip code with under 3.0 months of inventory — such as 78739, 78728, or 78750 — has genuine pricing power and can list at or near market value with confidence. In these markets, well-priced homes are still attracting multiple offers and selling above list. In contrast, a seller in a market with 7.0 or more months of inventory, such as Bastrop, San Marcos, or Lago Vista, should prioritize accurate market pricing from the first day of listing. Overpricing in a high-inventory market accelerates days on market, which in turn signals weakness to buyers and often results in steeper reductions later. The Austin real estate forecast for 2026 suggests this pricing discipline gap between tight and loose markets will remain an important factor throughout the year.