Austin Real Estate Market Report – Inventory Per Capita Signals Emerging Second-Phase Correction
Published | Posted by Dan Price
Austin Real Estate Market Report – Inventory Per Capita Signals Emerging Second-Phase Correction
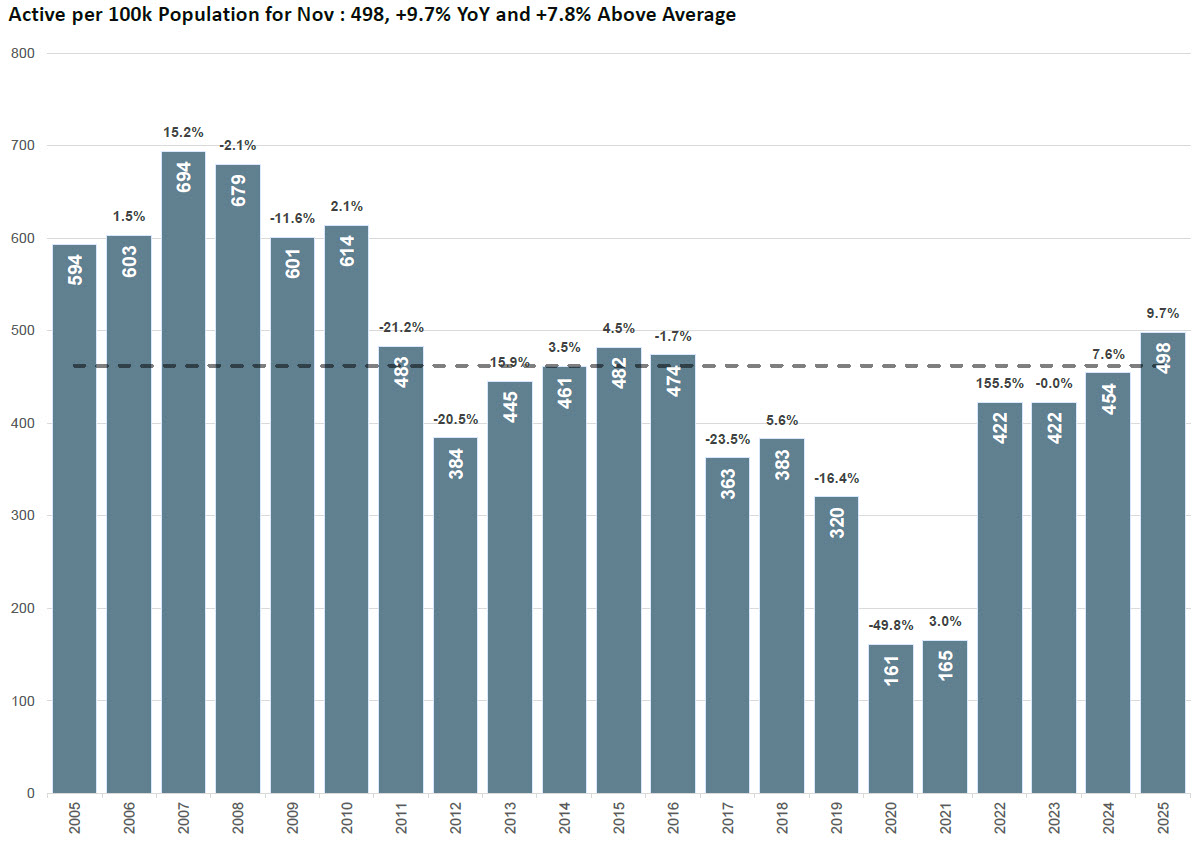
Active housing inventory per capita has returned to levels not seen in more than a decade, signaling a pivotal moment for the Austin real estate market. With 498 active listings per 100,000 residents this November, up 9.7% year-over-year and 7.8% above the long-term average, the data suggests that supply is now growing faster than population-adjusted demand. This is the highest per-capita inventory since 2010, just before the market transitioned into a nine-year contraction. Today’s numbers indicate that Austin is firmly in the oversupply phase of its current market cycle, with stabilization at lower pricing levels occurring but no clear evidence yet of pressure relief from demand-side forces.
From 2005 to 2010, inventory levels per capita followed a similar trajectory, rising to 694 listings per 100k residents in 2007 before beginning a gradual contraction. The previous cycle peak occurred in 2010 at 614 listings, which was followed by nearly a decade of downward movement as the market corrected. Between 2011 and 2019, the Austin housing market absorbed excess supply through sustained population growth and strong buyer demand, reaching its lowest point in 2020 at just 161 listings per 100k residents, a 49.8% year-over-year decline at the time. The current rebound from that low now represents a 209% increase in inventory relative to population, signaling a dramatic reversal driven by widening affordability gaps and slowing absorption.
The magnitude and pace of inventory growth reflect the shifting dynamics of the Austin property market. While pandemic-era demand and ultra-low inventory between 2020 and 2022 drove the extreme compression phase, the rapid rise back to 498 listings per 100k suggests the market is not just normalizing but entering a potential second-stage correction. Typically, when inventory per capita crosses above long-term trend levels without a corresponding improvement in absorption metrics, listing longevity increases and downward pressure on Austin home prices intensifies. This aligns with recent behavior seen across much of Central Texas, where higher price tiers and suburban inventory segments are experiencing increased discounting as sellers compete more aggressively.
Historically, correction cycles accelerate when per-capita inventory sustains above trend for multiple periods. In both the 2008–2010 and 2023–2025 windows, the initial rise above trend preceded pricing adjustments. However, today’s market differs in one key area: demand behavior is not softening abruptly but gradually. Rather than a crash-induced correction, the Austin market is recalibrating through prolonged supply saturation and slower buyer activity. That means pricing relief for buyers continues, but sellers in particular market segments will need to price strategically and emphasize competitive value to secure activity.
In reviewing the long-term data, the 2005–2010 period marked the expansion and peak phase of that cycle. From 2005 (594 per 100k) to 2007 (694 per 100k), per-capita inventory climbed steadily before declining amid price compression. A similar dynamic has emerged between 2022 and 2025, with inventory plateauing at 422 per 100k in 2022, holding flat in 2023, rising to 454 in 2024, and now reaching the current high of 498. The consistency of this upward trend confirms that inventory volume is growing faster than population-adjusted buyer activity, further illustrating the imbalance between supply expansion and absorption capacity.
For the Austin real estate forecast, this chart provides meaningful insight. Inventory levels per capita approaching the 500 mark typically coincide with pricing equilibrium or eventual softening. During the 2010 cycle, inventory peaked 19% higher than today’s level before declining. With active listings per capita now nearing peak thresholds, further increases without meaningful improvement in demand could prompt intensified pricing recalibrations in 2026. Given how builders are already using concessions to maintain volume, resale listings face greater vulnerability unless positioned differently. Value selling, strategic staging, and proactive pricing will be critical for maintaining competitiveness in a supply-heavy environment.
Although affordability continues to challenge entry-level and mid-market segments, higher inventory may offer buyers more flexibility and negotiation opportunity compared to the previous cycle. However, extended inventory duration does not automatically equal downward pricing unless absorption declines materially. As of now, the data reflects a sustained environment of correction—not a freefall—where pricing adjustments are happening progressively rather than abruptly.
Ultimately, the November 2025 supply position conveys a clear message: population-adjusted active inventory has reached a level that historically precedes pricing realignment if left unchecked. The last time Austin sat at this position relative to population, the market embarked on a downward trajectory that lasted eight years. The current path suggests 2026 will be a defining year in determining whether Austin stabilizes or accelerates toward a second-phase correction, particularly if inventory rises further.
For agents, this means value articulation and pricing precision are non-negotiable. For sellers, realistic positioning is the only viable path to maintaining competitiveness. For buyers, broader selection and negotiability remain key advantages. And for investors, cyclical timing suggests acquiring strategically at the right price point may unlock long-term upside as the market transitions. Inventory behavior rarely lies. And based on this chart, it is clearly signaling the direction of competitive momentum in the Austin housing market for the coming year.
FAQ
What does 498 active listings per 100,000 population indicate for the Austin real estate market?
It indicates that supply levels are rising faster than population-adjusted demand, reaching the highest point since 2010. Historically, when inventory per capita moves above long-term trend levels, pricing pressure increases until absorption improves.
How does today’s inventory compare to the previous market cycle?
The previous peak occurred in 2010 at 614 listings per 100k residents. The current reading of 498 is 19% below that level but represents a 209% increase since the 2020 low. The last time inventory per capita hit this range, the market entered a long-term contraction phase.
Is this level of supply likely to drive home prices down?
Rising inventory per capita typically contributes to downward pricing pressure, especially if absorption does not strengthen. While the correction appears gradual rather than abrupt, further increases in supply without higher demand would likely prompt continued price adjustments.
What does this mean for buyers in the current market?
Higher inventory per capita benefits buyers by increasing selection and negotiation leverage. This may provide opportunities for strategic purchases, particularly if sellers need to reduce pricing or offer concessions to remain competitive.
How should sellers respond to these emerging inventory trends?
Sellers should prioritize accurate pricing and value positioning from day one. Overpricing against a backdrop of elevated per-capita inventory leads to longer market times and increased discount risk. Data-driven pricing strategies are essential in the current market cycle.