Austin Housing Market Update: Inventory Tightens as Prices Grind Higher
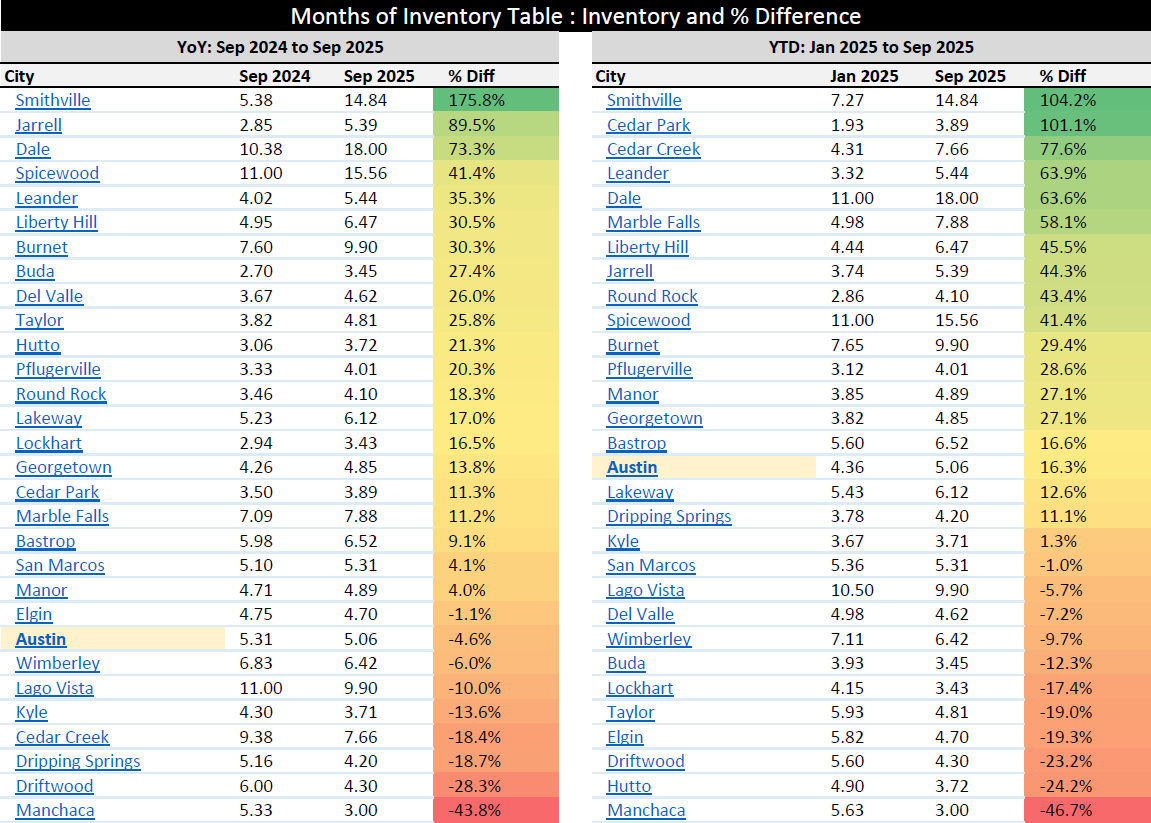
Austin just delivered a rare and constructive pairing for a cooling cycle: inventory eased year over year while both the average and median sold prices in the City of Austin moved higher. Months of inventory fell from 5.31 in September 2024 to 5.06 in September 2025, a 4.6% contraction that points to firmer balance between buyers and sellers inside the city limits. At the same time, the average sold price rose from $752,540 to $769,613, up 2.3% year over year, and the median sold price increased from $572,400 to $580,000, up 1.3% year over year. For readers tracking the austin housing forecast and broader austin real estate trends, this combination suggests the core of the austin property market is stabilizing faster than many surrounding cities.
Months of inventory is a simple but powerful measure of supply-and-demand tension. It answers the question: how many months would it take to sell the current active listings at the recent pace of sales? In Austin, slipping from 5.31 to 5.06 months means there was relatively less supply competing for each buyer this September compared with last September. While 5 months still reflects a largely balanced market, moving in the direction of tighter supply often precedes firmer pricing, particularly when combined with steady demand. That is consistent with what we see in the price tape. The average sold price in the City of Austin advanced 2.3% year over year, from $752,540 in 2024 to $769,613 in 2025. The median sold price—the better barometer for what a “typical” buyer paid—also edged up 1.3%, from $572,400 to $580,000. In practical terms, fewer months of inventory plus modest price gains equals a market that is digesting prior excess and moving toward equilibrium.
For context, many nearby submarkets did not post the same combination this year. Across the region, only 9 cities showed a year-over-year increase in average sold price while 21 declined, and 11 cities saw a year-over-year increase in median sold price while 19 declined. Austin lands on the positive side of both ledgers, which is notable given that several fast-growing suburbs are still giving back some of their 2021–2022 run-up. Leander’s average price, for example, is down 6.7% year over year, and Wimberley’s average is down 7.8% year over year. The takeaway for the austin real estate market is that the urban core is behaving more resiliently than many outlying areas, with tighter supply translating into steadier pricing.
Seasonality and intra-year dynamics are also worth noting. From January 2025 to September 2025, Austin’s months of inventory rose from 4.36 to 5.06, a 16.3% increase, reflecting the normal late-spring and summer build in active listings before autumn re-balancing. Yet the year-over-year comparison remains the more important signal for the austin real estate forecast, because it strips out seasonality. On that basis, Austin’s supply picture improved versus last year, and prices nudged higher. When inventory contracts year over year and prices firm, it typically means sellers are gaining a little leverage back after a period of buyer-favored conditions.
Buyers reading this austin housing market update should interpret today’s data as a shift from wide-open negotiating lanes toward more selective opportunities. With inventory down compared to last September and the median sold price slightly higher, attractive, well-priced homes in Austin are less likely to linger and invite large discounts. That does not mean overpaying; it means the austin property market now rewards preparation, clean offers, and fast execution on homes that clearly price to value. The median moving up 1.3% suggests more transactions are clustering near the heart of the market rather than skewing down into lower price tiers. In other words, buyers still have choices, but the best listings are getting absorbed efficiently.
Sellers should take the same data as encouragement paired with discipline. Months of inventory at roughly five is not a runaway seller’s market, but it is materially more supportive than last year’s reading. The average price increase of 2.3% confirms that buyers continue to pay for location, condition, and presentation. The playbook remains the same: price to the market you have, present the home impeccably, and lean into the first two weeks of market time. In a city where the austin real estate report now shows incremental price appreciation alongside a modest year-over-year inventory decline, the spread between “almost right” and “exactly right” on pricing can decide whether you close in 21 days or chase the market for 60.
Investors and analysts tracking austin home prices and austin housing trends should view this as a mid-cycle stabilization rather than a late-cycle re-acceleration. The data we’re using here are citywide aggregates, and they show broad health without suggesting froth. Median up 1.3% year over year and average up 2.3% are paced, not spiking. When paired with a modest YoY improvement in supply, the austin market forecast for the next quarter leans toward continued price stability with pockets of outperformance in neighborhoods where inventory is structurally tight due to limited new supply or unique demand drivers. Conversely, segments with heavier new-build competition may continue to price more defensively even as the citywide numbers firm.
From a process standpoint, these readings also help set expectations. If you are advising a client who is comparing 2025 Austin to 2024 Austin, you can state plainly that supply is thinner and prices are slightly higher on both average and median bases. That is a concise way to explain why the negotiation tone may feel firmer this fall than it did last fall, and why buyers who were waiting for deeper discounts in the city are now encountering a more disciplined market. Meanwhile, sellers who price well should expect competent buyers to show up faster and with clearer intention. This is exactly what a healthier austin real estate market looks like as it exits a corrective phase—less noise, fewer outliers, and tighter spreads between list and sold.
FAQ: Austin Housing Forecast and Market Mechanics
Is the Austin real estate market improving in 2025?
Yes. Compared with September 2024, Austin’s months of inventory is lower and both the average and median sold prices are higher, which indicates a market that is stabilizing and regaining balance. Lower supply against steady demand typically supports firmer pricing, and that’s what citywide aggregates now show year over year.
What does “months of inventory” mean, and why does it matter?
Months of inventory estimates how long it would take to sell all current listings at the recent sales pace. Austin moved from 5.31 months in September 2024 to 5.06 months in September 2025. That shift toward lower inventory means relatively fewer options per buyer, which can reduce days on market and narrow negotiation ranges when homes are priced correctly.
Are Austin home prices rising or falling right now?
They are rising modestly on a year-over-year basis. The average sold price in Austin increased 2.3% and the median sold price rose 1.3% from 2024 to 2025, based on citywide data. For the austin housing forecast, modest, broad-based gains paired with stable inventory often signal sustained price stability rather than sharp swings.
How does Austin compare with nearby cities in 2025?
Austin is outperforming many surrounding markets. Regionally, only 9 cities posted year-over-year gains in average sold price and 11 posted gains in median sold price, leaving most cities flat to down. Several suburbs still show average price declines year over year, underscoring the relative resilience of the city core.
What does this mean for buyers and sellers over the next quarter?
For buyers, expect fewer “easy” discounts and a premium on speed and clean terms for well-priced homes. For sellers, pricing precisely to the current comp set and presenting top-tier condition should produce stronger early-week traffic and tighter list-to-sale outcomes. Given the data in this austin housing market update—lower YoY inventory and slightly higher prices—the baseline outlook is stable to slightly firm.