Real Estate Investment Opportunities in Austin: Uncovering Deals in a Shifting Market
The Austin real estate market in April 2025 offers a wealth of data for investors seeking opportunities in a dynamic landscape. With a growing number of properties and zip codes showing promising returns, investors can use detailed metrics to identify potential deals. The Austin-area Multiple Listing Service (MLS) reported 14,793 active listings in April 2025, a 6.04% increase from 13,950 in April 2024.
This rise in inventory, coupled with 5.39 months of inventory compared to 4.22 months the previous year, suggests a market with more options for buyers. The median active price across the Austin area reached $440,000, up 2.33% from $430,000, while the median sold price climbed to $429,990, a 1.25% increase from $424,700. Within the city of Austin, the median sold price hit $600,000, reflecting a 7.43% year-over-year growth from $558,495, highlighting the city’s strong demand.
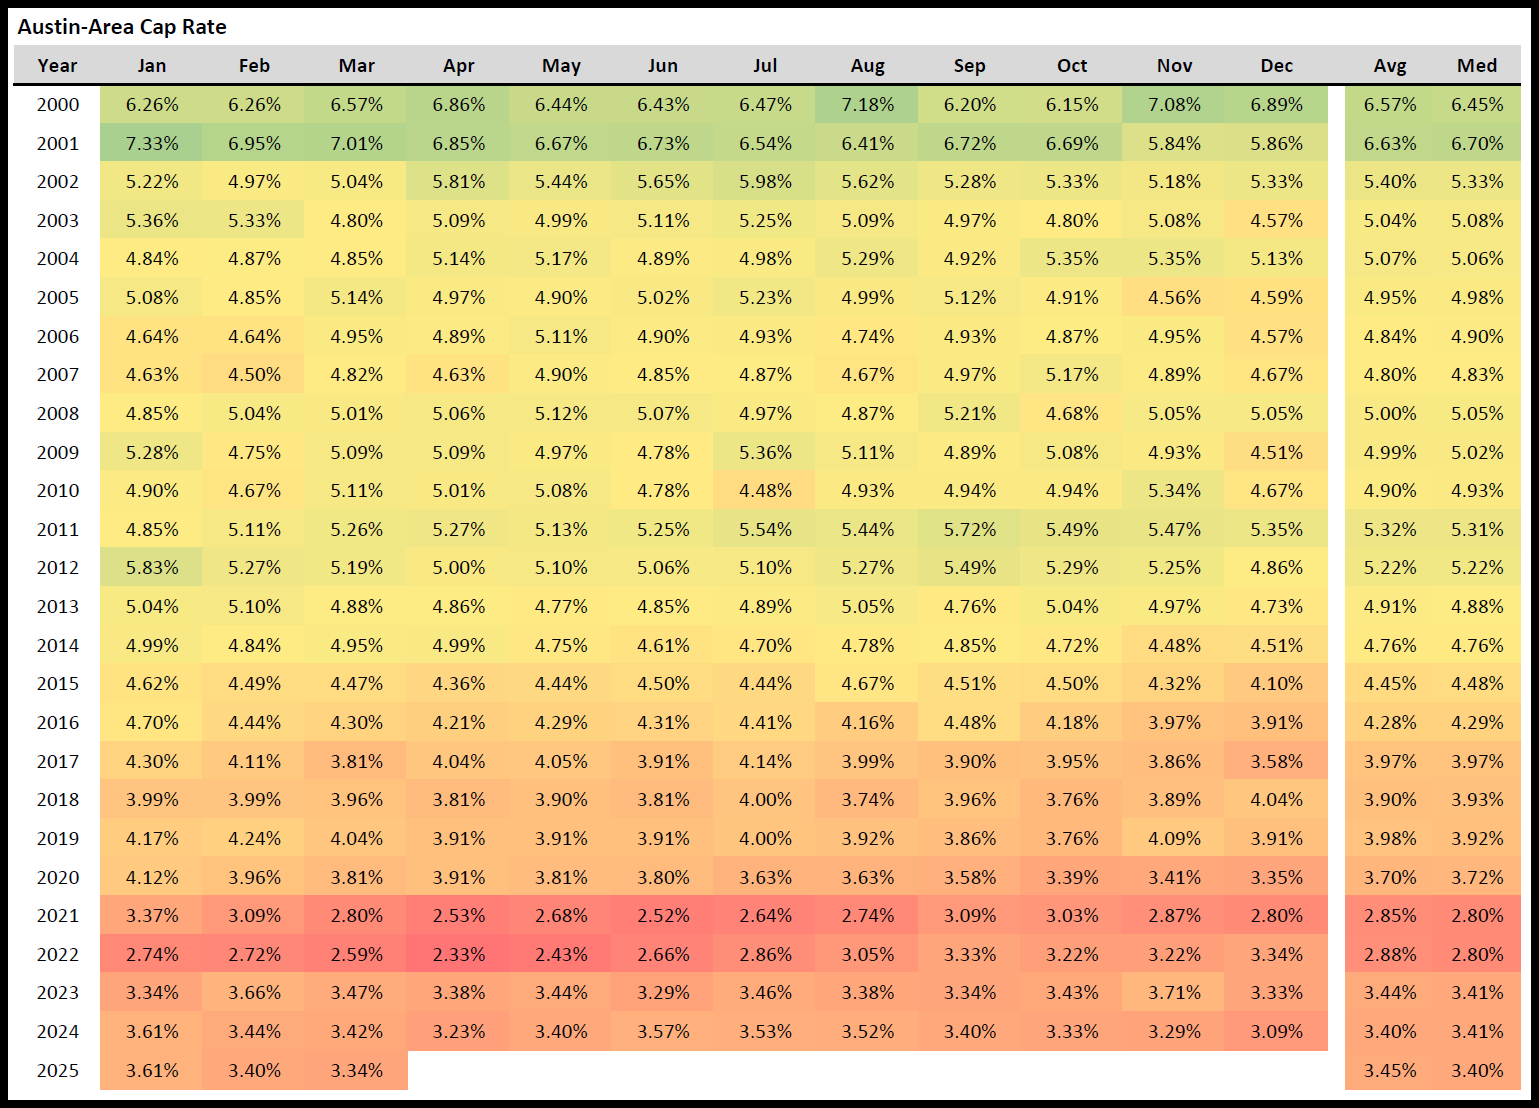
One key metric for investors is the capitalization rate, or cap rate, which measures the return on a property based on its net operating income (NOI) divided by its purchase price. NOI is calculated by subtracting total expenses, including property taxes and a 5% maintenance allowance, from gross annual rent. In March 2025, the Austin-area cap rate averaged 3.34%, but 17 out of 75 zip codes surpassed the 6-month Treasury Bill yield of 4.28%.
This is the highest number of zip codes exceeding this benchmark in over four years. For example, zip code 78654 in Marble Falls posted a cap rate of 6.31%, with a median sold price of $352,500 and gross rent of $30,327 annually. Similarly, zip code 78724 in Austin achieved a 5.49% cap rate, with a median sold price of $312,500 and gross rent of $25,368. These figures indicate areas where rental income could outpace the returns of risk-free investments like Treasury Bills.
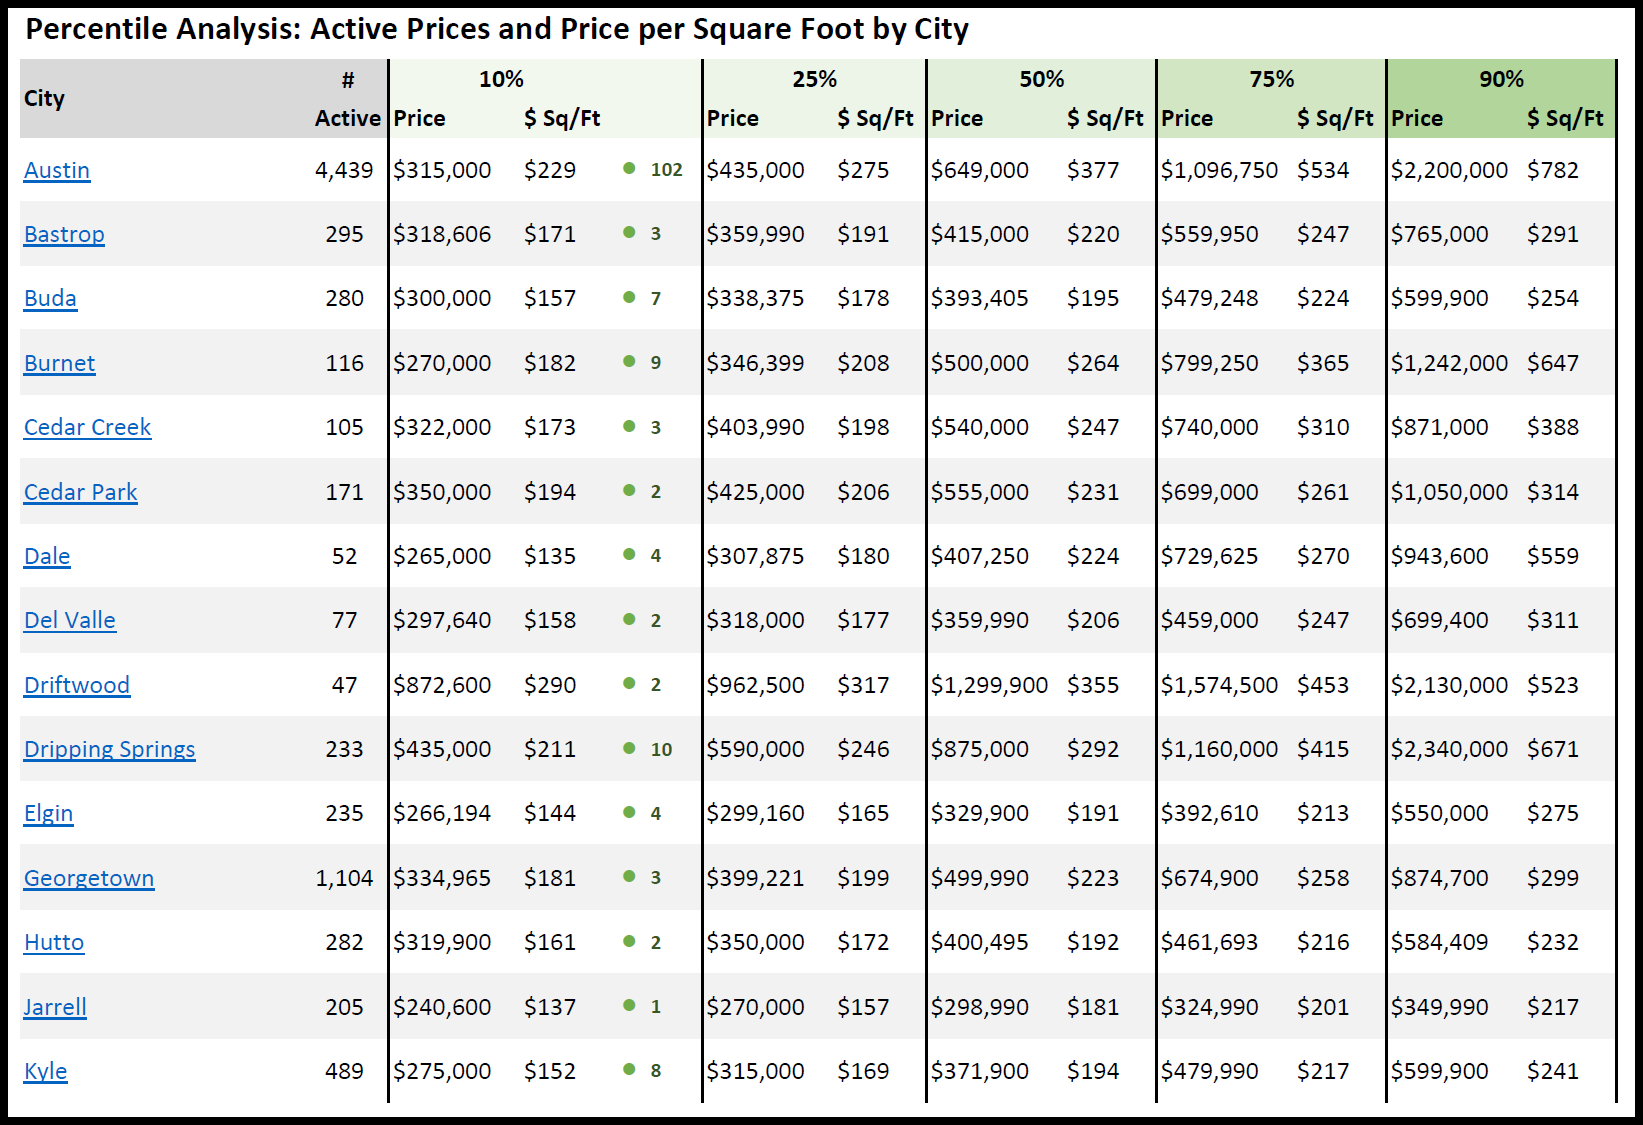
Another avenue for finding deals lies in properties priced below market norms. Across 30 tracked cities in the Austin area, 264 properties were listed below both the 10th percentile for price and price per square foot. In the city of Austin, where 4,439 homes were active, the 10th percentile price was $315,000, and the 10th percentile price per square foot was $229. Out of these, 102 properties fell below both thresholds, representing potential value buys. For instance, in Pflugerville (zip code 78660), the 50th percentile active price was $450,000 with a price per square foot of $207, but investors could target properties closer to the 10th percentile of $330,000 and $173 per square foot to maximize value. This approach allows investors to pinpoint homes that may be underpriced relative to the broader market.
Breaking down the market by zip code reveals further opportunities. Zip code 78725 in Austin, with a median sold price of $299,000 and a cap rate of 5.55%, stands out as a strong candidate for cash-flow-focused investors. Its gross rent of $23,170 and NOI of $16,605 suggest solid returns. In contrast, zip code 78747 in Austin, with a median sold price of $396,185 and a cap rate of 4.30%, offers a slightly higher entry point but still exceeds the Treasury Bill yield. These zip codes, among the 17 identified, provide a starting point for investors seeking properties with favorable rental yields. Meanwhile, areas like Jarrell (zip code 76537) with a cap rate of 4.58% and a median sold price of $277,000 demonstrate that lower-priced markets can also deliver competitive returns.
Price trends over the past year offer additional context for deal hunters. In Austin, the 50th percentile sold price rose 7.4% from April 2024 to April 2025, reaching $600,000, while the 10th percentile price dipped slightly by 0.1% to $324,580. However, some nearby cities showed softer trends. Liberty Hill’s 50th percentile sold price fell 18.5% to $439,900, and Kyle’s dropped 7.9% to $323,500. These declines, combined with increased inventory, could signal opportunities for investors to negotiate better terms. For example, Leander (zip code 78641) had a 50th percentile active price of $549,000 but a sold price of $469,550, indicating potential room for offers below list prices.
The percentile analysis also highlights disparities within zip codes. In Austin’s zip code 78702, the 50th percentile active price was $725,000 with a price per square foot of $525, but the 10th percentile was $400,000 and $400 per square foot. Investors targeting this lower tier could find properties significantly below the area’s median. Similarly, in Round Rock (zip code 78665), the 50th percentile active price was $466,958, while the 10th percentile was $335,000, suggesting deals exist for those willing to explore the lower end of the market. Across the board, the data shows that active listings often carry higher prices than recent sales, with Austin’s 78732 zip code showing a 73.2% premium at the 50th percentile for active ($1,277,500) versus sold ($737,500) prices.
For investors focused on long-term strategy, understanding inventory dynamics is crucial. The Austin-area MLS reported a 27.61% increase in months of inventory, from 4.22 to 5.39, indicating a slower absorption rate. Within the city of Austin, months of inventory rose 11.52% to 5.65 from 5.06. This shift suggests a market tilting toward buyers, as properties stay listed longer. Zip code 78724, with 6.2 months of inventory, and 78654, with 10.3 months, reflect this trend, potentially giving investors leverage to negotiate. Conversely, areas like 78747, with 3.3 months, remain tighter, requiring a more aggressive approach to secure deals.
The data underscores the importance of targeting specific metrics when investing in Austin. Whether focusing on high-cap-rate zip codes like 78616 in Dale (4.99%, median sold $315,000) or scouring for properties below the 10th percentile in cities like Georgetown (10th percentile $334,965, $181 per square foot), investors have multiple paths to uncover value. The combination of rising inventory, softening prices in certain areas, and a record number of zip codes offering cap rates above the Treasury Bill yield creates a fertile ground for strategic purchases. For those looking to dive deeper, a tailored analysis can further refine these opportunities.
Investing in Austin’s real estate market requires a nuanced approach, but the numbers provide clear guideposts. By leveraging data on cap rates, percentiles, and inventory trends, investors can identify properties that align with their financial goals. Whether it’s a low-priced home in Elgin (zip code 78621, median sold $303,160, cap rate 4.13%) or a high-yield property in Marble Falls, the Austin area in April 2025 offers a range of possibilities for those willing to dig into the details. If you’re interested in exploring these opportunities, reach out to Team Price Real Estate for a detailed analysis. We can evaluate properties using metrics like the 1% Rule, Gross Rent Yield, Cap Rate, and Cash Flow Analysis to pinpoint the best deals in Austin’s evolving market.
FAQ Section
What is a good cap rate for real estate investment in Austin?
In March 2025, the average cap rate in the Austin area was 3.34%, but 17 out of 75 zip codes exceeded the 6-month Treasury Bill yield of 4.28%. A cap rate above 4.28%, such as 6.31% in zip code 78654 (Marble Falls) or 5.55% in 78725 (Austin), is generally considered strong for Austin, as it surpasses the risk-free return of Treasury Bills. Higher cap rates indicate better potential returns, but investors should also consider property condition and market trends.
How can I find undervalued properties in Austin?
Investors can target properties below the 10th percentile for both price and price per square foot. In April 2025, 264 properties across 30 Austin-area cities fell into this category. For example, in Austin, the 10th percentile price was $315,000 with a price per square foot of $229, and 102 homes met both criteria. Zip codes like 78724 (median sold $312,500) or 76537 (Jarrell, $277,000) offer lower entry points with cap rates above 4.28%, making them prime areas for value buys.
Is now a good time to invest in Austin real estate?
In April 2025, Austin’s real estate market showed 5.39 months of inventory, up 27.61% from 4.22 months in 2024, suggesting more choices for buyers. The city’s median sold price rose 7.43% to $600,000, but some areas like Liberty Hill saw an 18.5% drop to $439,900. With 17 zip codes offering cap rates above the 4.28% Treasury Bill yield, the highest in over four years, investors have opportunities to find high-yield properties, particularly in a market with growing inventory.