Austin Real Estate Activity Surges in Early 2026: What the Data Is Telling Us
Team Price Real Estate | March 9, 2026
Something meaningful is happening in the Austin real estate market, and the numbers are making it impossible to ignore. As of March 9, 2026, the Austin Activity Index has climbed to 23.9% — nearly matching last year's reading of 23.8% at the same point in time — and it has done so after bottoming out at just 19.1% as recently as January 9, 2026. That is a gain of nearly five full percentage points in just two months. For a market that spent much of 2025 searching for its footing, this kind of upward trajectory in the austin real estate market is a signal worth examining closely.
Understanding the Activity Index and What It Measures
The Activity Index is one of the most reliable leading indicators in the Austin housing market. It is calculated by dividing pending sales by active listings, which produces a ratio that reflects how quickly the market is absorbing available homes. A higher Activity Index means more homes are going under contract relative to the total pool of listings — essentially, demand is keeping pace with or outrunning supply. When this index rises, it tends to foreshadow increased sales volume and, over time, upward pressure on pricing.
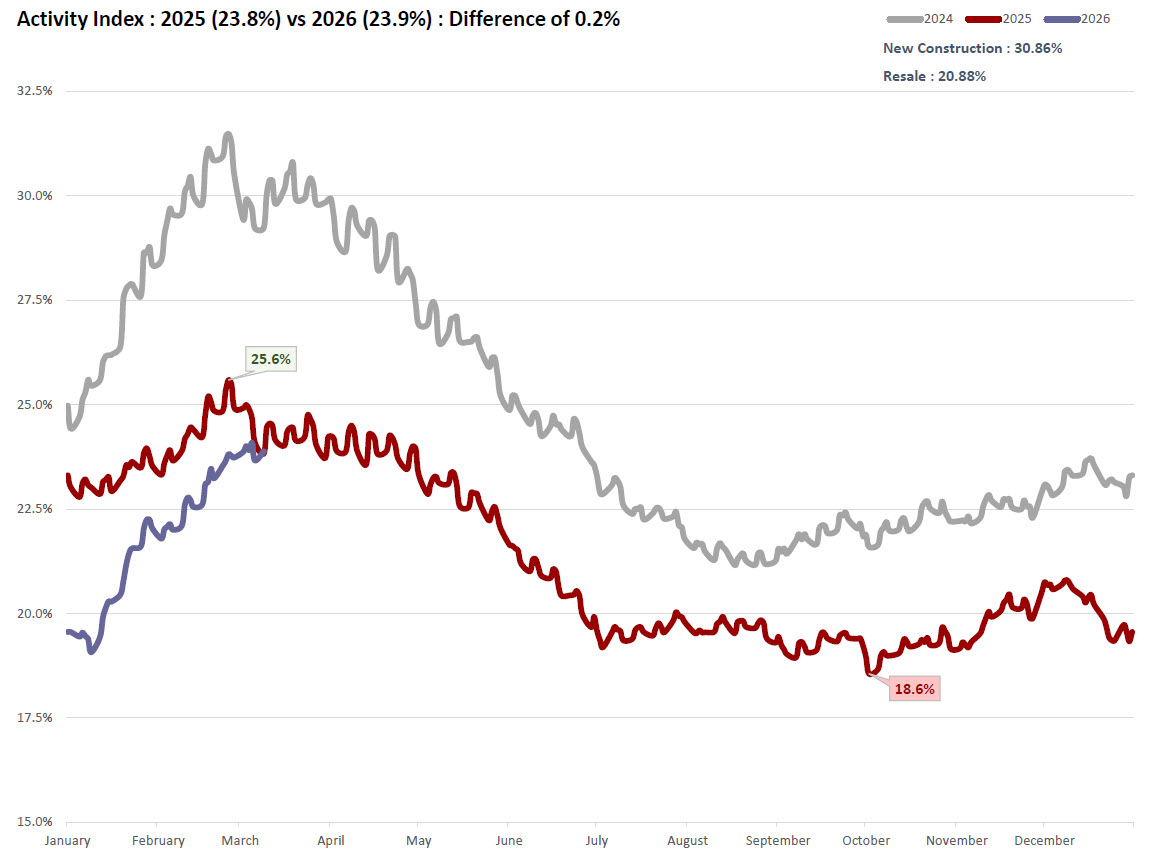
At 23.9% today versus 23.8% a year ago, the current reading represents a difference of just 0.2 percentage points year over year. That near-parity with 2025 is actually quite significant given where this metric stood six months ago. Through the back half of 2025, the Activity Index struggled, touching a low of 18.6% in late October before beginning a slow recovery. The fact that 2026 has already clawed back to parity with 2025 — and has done so within the first ten weeks of the year — reflects a meaningfully more active austin housing market than most forecasters anticipated heading into the new year.
Pending Sales Are Leading the Way — and Setting a New High-Water Mark
The pending sales data is where the current austin real estate trends become most compelling. As of today, pending listings stand at 4,341, compared to 4,043 at this same point in 2025. That is a year-over-year increase of 7.4%, which represents the highest pending year-over-year growth rate since December 30, 2024, when it registered at 7.7%. In other words, the pace at which buyers are going under contract on homes is now at a multi-month high — and accelerating heading into the spring selling season.
Pending sales are widely regarded as the most forward-looking metric in any real estate report because they capture buyer behavior before transactions actually close. When pending activity rises this decisively heading into spring — traditionally the most active period for austin housing market movement — it is an early signal that closed sales in the weeks and months ahead are likely to reflect that same momentum. Buyers who have been sitting on the sidelines are increasingly making moves, and the data is starting to confirm that shift.
Active Listings Are Rising — But Not as Fast as Demand
On the supply side, active listings have grown year over year as well, reaching 13,842 today versus 12,928 at this point in 2025. That is a 7.1% increase. While more inventory might initially sound like a headwind to the market, context matters significantly here. This year-over-year inventory increase of 7.1% is actually at its lowest level since January 19, 2024, when active listings were running just 6.4% above the prior year. What this means is that inventory growth, while still present, is decelerating. The gap between supply and demand is beginning to narrow.
This dynamic is critical to understanding the broader austin real estate forecast heading into spring 2026. When pending sales are growing at 7.4% year over year and active listings are only growing at 7.1%, the scales are tipping ever so slightly in favor of buyers absorbing available supply more efficiently than before. The Activity Index rising from 19.1% to 23.9% between January and March confirms this: demand has strengthened faster than supply has grown, which is exactly the combination that supports market stabilization and potentially price recovery.
New Construction vs. Resale: A Market Within a Market
One of the most revealing dimensions of the current Austin property market is the divide between new construction and resale activity. The Activity Index for new construction currently sits at 30.86%, while resale stands at 20.88%. That gap of nearly 10 percentage points tells an important story: new construction homes are going under contract at a substantially higher rate relative to their available inventory than resale homes are.
Several factors help explain this divergence. Builders have been offering aggressive incentives — including mortgage rate buydowns, closing cost contributions, and price reductions — that have made new construction particularly attractive in the current rate environment. Resale sellers, by contrast, are often reluctant to reduce list prices or offer concessions at the same scale, which can slow absorption. As a result, the new construction segment is currently operating in a notably more competitive environment than the resale segment, a distinction that buyers, sellers, and investors navigating the Austin housing market should keep in mind.
The Recovery Trajectory: From January Lows to a Spring Surge
To fully appreciate what the current data represents, it is worth stepping back and viewing it in the context of the full recovery trajectory. The Activity Index for 2025 peaked in early March at 25.6% before beginning a sustained decline that carried it all the way down to 18.6% in late October — a drop of 7 full percentage points across roughly seven months. The 2024 data, which serves as the benchmark in the chart above, traced a similar seasonal arc but at a consistently higher level throughout the year, peaking near 31% in spring.
The 2026 line is now tracking above 2025 at the same calendar point and rising. Starting at 19.1% on January 9, the index has gained nearly 5 full percentage points in just two months. If the seasonal pattern holds and the index continues climbing toward its spring peak, the Austin real estate market could approach or match last year's March high of 25.6% — and potentially exceed it if the current demand momentum continues. That is a materially better outlook than the austin real estate trends suggested just six to eight weeks ago.
What This Means for Buyers and Sellers in Austin Right Now
For sellers, the improving Activity Index and rising pending volume represent genuinely encouraging austin housing trends. The market is more active than it has been since the end of last year, and the rate at which buyers are absorbing available inventory is accelerating. This does not mean sellers can return to peak-cycle pricing expectations, but it does mean that well-priced, well-presented homes are finding buyers more readily than they were in late 2025. Properly calibrated pricing and preparation remain essential, but the conditions are becoming incrementally more favorable.
For buyers, the current environment still offers meaningful advantages compared to the frenzied competition of 2021 and 2022. With 13,842 active listings providing a wide range of choices and the Activity Index still well below historical peaks, buyers retain negotiating leverage — particularly in the resale segment where the 20.88% Activity Index reflects slower absorption. However, the window for peak buyer leverage may be narrowing. If pending activity continues at this pace through the spring selling season, competition will likely intensify, especially in high-demand price ranges and zip codes across the Austin market.
Looking Ahead: Key Indicators to Watch in the Coming Weeks
The next several weeks will be critical for confirming whether the current momentum in the Austin housing market update represents a durable trend or a temporary seasonal uptick. Several data points will be particularly telling. The Activity Index approaching or surpassing 25% would signal that 2026 is on track to outperform 2025 seasonally. Continued year-over-year pending growth above 5% would confirm that buyer demand is accelerating, not just maintaining last year's pace. And any deceleration in active listing growth — ideally moving toward or below 5% year over year — would indicate that supply is normalizing relative to demand.
The Austin real estate market has been through a complex correction cycle since its peak in 2022. What the data from the first nine weeks of 2026 is beginning to suggest is that the market may be moving into a more stable and constructive phase. The leading indicators — pending sales growth, Activity Index recovery, and decelerating inventory growth — are all pointing in the same direction. That convergence is meaningful, and it is the kind of signal that the Austin housing market data has not consistently produced in quite some time.
Frequently Asked Questions
What is the Activity Index and why does it matter for the Austin real estate market?
The Activity Index measures the ratio of pending sales to active listings in a given market, expressed as a percentage. In the Austin real estate market, it functions as a leading indicator of market health — when the index is rising, it means buyers are absorbing available homes at an increasing rate, which typically precedes higher closed sales volume and, over time, upward pressure on prices. As of March 9, 2026, Austin's Activity Index stands at 23.9%, up from a low of 19.1% just two months earlier. Tracking this metric over time allows buyers, sellers, and investors to identify shifts in market momentum before they show up in lagging indicators like median sold price.
Is the Austin housing market improving in 2026?
The early 2026 data points toward meaningful improvement in the Austin housing market. Pending listings are up 7.4% year over year — the highest growth rate since late December 2024 — while the Activity Index has risen nearly 5 percentage points since early January. These are leading indicators, meaning they tend to precede improvement in broader market metrics like closed sales and median price. The year-over-year inventory growth rate is also at its lowest point since January 2024, suggesting that supply growth is beginning to decelerate relative to demand. Together, these trends paint a picture of a market gaining momentum heading into the spring selling season.
How does new construction compare to resale in Austin right now?
The Activity Index for new construction in Austin currently sits at 30.86%, compared to 20.88% for resale homes — a gap of nearly 10 percentage points. This means new construction homes are going under contract at a significantly higher rate relative to available inventory than resale homes. Builders have been offering substantial incentives, including mortgage rate buydowns and closing cost assistance, which have made new construction particularly compelling for buyers in the current interest rate environment. Resale sellers who are competing with new construction need to be especially mindful of pricing and condition to attract buyers who have the option of purchasing a brand-new home with incentive packages attached.
What do rising pending sales mean for Austin home prices?
Rising pending sales are one of the most reliable forward-looking indicators of future closed sales volume and, ultimately, pricing trends in the Austin real estate market. When more homes go under contract — as reflected in today's 7.4% year-over-year increase in pending listings — it signals strengthening buyer demand that has yet to show up in official closed-sale statistics. If this trend continues through the spring, it is likely to translate into stronger closed sales numbers in the weeks ahead. Whether it translates into meaningfully higher home prices depends on how quickly active inventory grows in response; if inventory growth remains in the 7% range while pending growth stays at or above that level, the supply-demand balance will continue to tighten.
Is now a good time to buy a home in Austin, Texas?
Whether now is the right time to buy in Austin depends heavily on individual financial circumstances, but the current market data offers useful context for that decision. With 13,842 active listings providing a wide selection of available homes, buyers still have considerably more choice than they did during the 2021 and 2022 peak. The resale Activity Index of 20.88% indicates that absorption remains moderate, giving buyers time to evaluate options and negotiate without the extreme pressure of a peak-cycle market. However, the improving trend in pending sales and the rising Activity Index suggest that buyer competition may increase as spring progresses. For buyers who are financially ready, acting early in the spring season may allow them to secure favorable terms before demand intensifies further.