Austin Real Estate Activity Index March 2026: A Metro Moving in Two Directions
Austin's real estate market is accelerating — but not everywhere at once. The latest Activity Index data for March 2026 tells a story of a metro in motion, with the urban core gaining momentum while several outer-ring suburbs continue to work through post-pandemic corrections. The citywide Austin Activity Index came in at 23.6% for March 2026, reflecting a 12.1% year-over-year gain. That's a meaningful signal: buyer demand is increasing relative to available inventory, and the market is becoming more competitive compared to this time last year.
What is the Activity Index? The Activity Index measures the percentage of active listings that went under contract in a given month. A higher reading means more listings are selling quickly relative to supply — a direct measure of market velocity.
The Big Picture: Austin Core Is Leading the Recovery
When you look at the full metro-wide dataset, a clear pattern emerges: communities closer to Austin's urban core and along the I-35 corridor are posting year-over-year gains, while many of the suburbs that boomed during 2020–2022 are still normalizing.
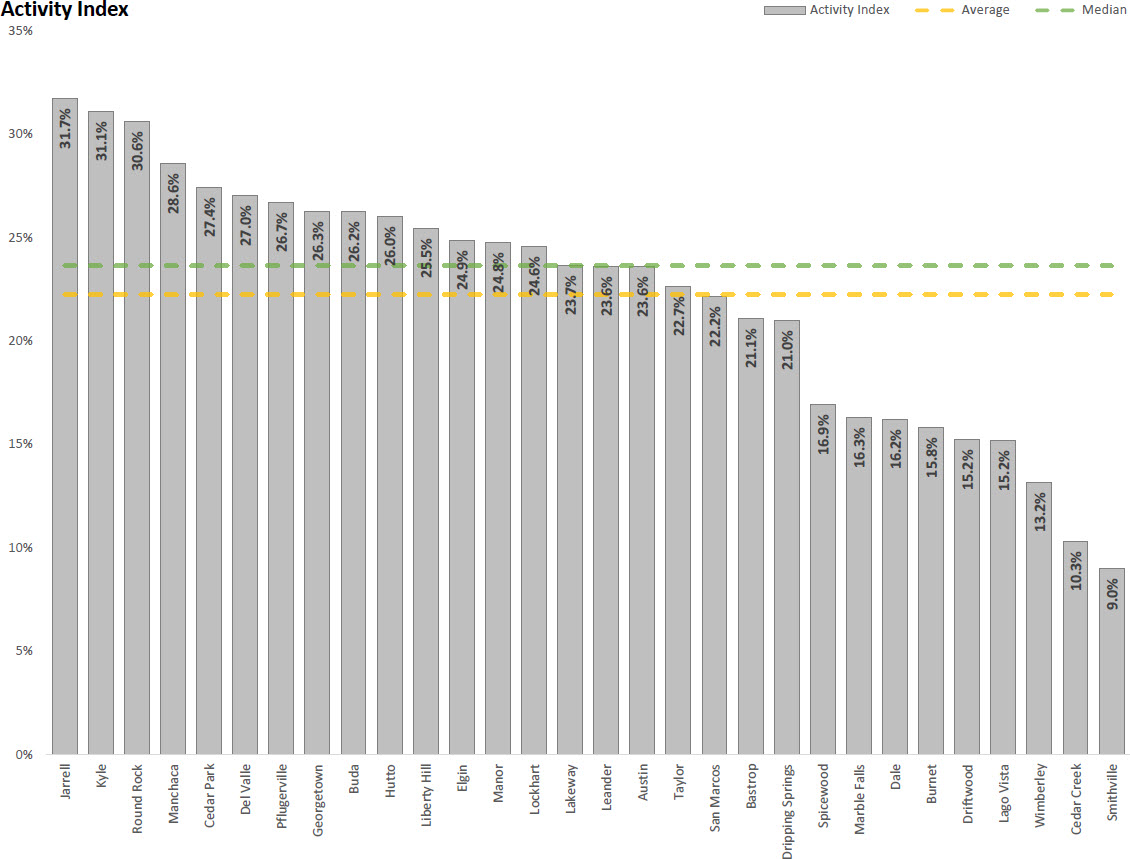
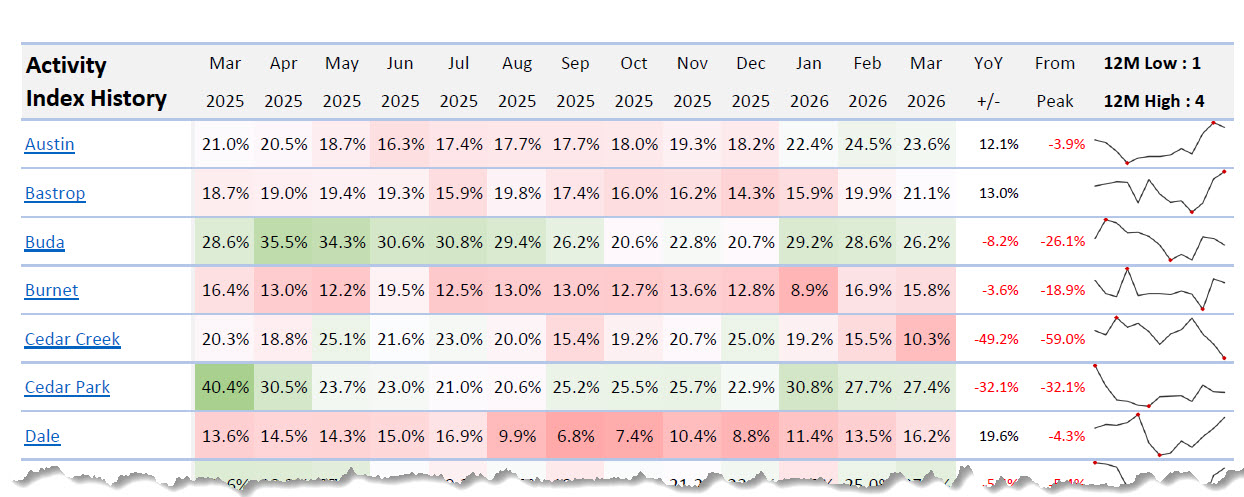
Austin proper is at 23.6%, up 12.1% YoY. That's not just a rebound — it reflects genuine demand re-anchoring in the city. Lakeway (23.7%, +5.9% YoY), Leander (23.6%, +5.7% YoY), and Round Rock (30.6%, +7.8% YoY) are all trending in the same positive direction.
Meanwhile, Kyle continues to post the highest absolute Activity Index in the entire metro at 31.1%, with Jarrell leading all markets at 31.7%. Both markets consistently outperform the metro average — suggesting persistent demand in specific price-accessible corridors.
Where Activity Is Rising Year-Over-Year
The following markets posted year-over-year gains in Activity Index — meaning buyer demand has grown relative to available supply compared to March 2025.
Austin city leads established urban markets with a 23.6% Activity Index, up 12.1% year-over-year. Bastrop is close behind at 21.1%, up 13.0% YoY, an emerging market gaining real traction with price-sensitive buyers. Round Rock continues to be one of the metro's strongest performers at 30.6%, up 7.8% YoY. Liberty Hill is building demand in the northwest growth corridor at 25.5%, up 7.7% YoY. Lago Vista, a lake community showing renewed buyer interest, comes in at 15.2%, up 7.4% YoY. Lakeway at 23.7% (+5.9% YoY) and Leander at 23.6% (+5.7% YoY) round out the western and northwestern suburbs rebounding from 2023–2024 softness. Two smaller markets also stand out: Dale at 16.2% (+19.6% YoY) and Manchaca at 28.6% (+19.0% YoY), with south Austin's emerging corridor posting particularly strong numbers.
The common thread among gaining markets: proximity to employment centers, relative price accessibility compared to the urban core, and limited new supply competing with resale inventory.
Markets Showing Year-Over-Year Softness
Not every corner of the Austin metro is accelerating. Several markets that surged during the pandemic-era demand wave continue to see activity pull back from peak levels.
Cedar Creek registered the sharpest relative decline in the dataset at 10.3%, down 49.2% year-over-year. Cedar Park, despite still sitting above the metro average in absolute terms at 27.4%, is running 32.1% below last year's pace. Wimberley's Hill Country lifestyle market has cooled to 13.2% (−24.2% YoY), while Smithville sits at 9.0% (−31.3% YoY). In the northeast suburbs, Pflugerville at 26.7% (−17.9% YoY) and Manor at 24.8% (−21.8% YoY) are both normalizing from elevated 2025 readings.
It's worth noting that markets like Cedar Park and Pflugerville still register above the metro average in absolute Activity Index — their year-over-year declines reflect how elevated they were in early 2025, not a collapse in current demand.
What the Metro Average and Median Tell Us
The metro average Activity Index sits at 22.2%, with a median of 23.7% in March 2026. Austin city at 23.6% is sitting essentially at the median — meaning half the markets in the Austin metro are less active, and half are more active than Austin proper.
This is a notable data point for buyers and sellers. Austin city was once far below many suburban markets in activity. The convergence toward the median suggests the city is becoming more competitive again as affordability pressures push some demand back inward from the outer suburbs.
What This Means for Buyers and Sellers
For buyers, markets above 25% Activity Index — Jarrell (31.7%), Kyle (31.1%), Round Rock (30.6%), Manchaca (28.6%), Cedar Park (27.4%), Pflugerville (26.7%), Georgetown (26.3%), Buda (26.2%), and Hutto (26.0%) — are highly competitive. Expect faster timelines and less negotiating room in these areas.
For sellers, if you're in Austin proper, Leander, Lakeway, or Round Rock, the year-over-year momentum is working in your favor. Demand is increasing relative to supply, and well-priced homes are moving. Spring 2026 is shaping up to be a favorable listing window.
For investors, markets like Bastrop (+13.0% YoY) and Lago Vista (+7.4% YoY) show increasing velocity at lower price points — worth monitoring for buy-and-hold opportunities before activity fully reprices.
Frequently Asked Questions
What is the Activity Index in Austin real estate?
The Activity Index measures what percentage of active listings went under contract in a given month. A 23.6% reading for Austin city means roughly 1 in 4 active listings received a contract that month. Higher readings indicate a faster, more competitive austin housing market. It's one of the most direct measures of real-time demand available in Austin real estate market data.
Which Austin suburb has the highest Activity Index in March 2026?
Jarrell leads all Austin-area markets in March 2026 with a 31.7% Activity Index, followed by Kyle at 31.1% and Round Rock at 30.6%. All three markets are significantly above the metro average of 22.2%, reflecting strong demand in price-accessible corridors north and south of the city.
Is Austin's real estate market getting more or less competitive in 2026?
More competitive compared to a year ago. Austin's citywide Activity Index is up 12.1% year-over-year, from 21.0% in March 2025 to 23.6% in March 2026. The urban core is gaining momentum as spring demand picks up, and several suburban markets along the I-35 corridor are following suit.
Why are some Austin suburbs showing declining activity?
Markets like Cedar Park, Pflugerville, and Manor surged during the 2020–2022 pandemic demand wave and are still normalizing from those elevated levels. Their year-over-year declines reflect high comparison points from early 2025, not a collapse in demand — most remain at or above the metro average in absolute terms, meaning they are still competitive austin housing markets.
What does a low Activity Index mean for homebuyers?
A lower Activity Index — like Smithville at 9.0% or Cedar Creek at 10.3% — means fewer listings are going under contract relative to supply. This gives buyers more time, more negotiating leverage, and potentially better pricing. These markets currently favor buyers and represent some of the most accessible entry points in the broader Austin real estate market.
Data as of March 6, 2026. Published by Team Price Real Estate. For neighborhood-level and zip-code-level activity data, visit teamprice.com/insight-and-statistics.