Austin Real Estate Market Update: The February 2026 Absorption Rate Is the Lowest on Record
The Austin real estate market is flashing a clear signal in February 2026, and buyers paying attention are in the strongest position they have been in over a decade. The Austin Absorption Rate — one of the most direct measures of supply and demand balance in any housing market — dropped to just 15% this February, the lowest reading in the entire data series going back to 2016. For anyone tracking austin real estate trends, this number tells a story that goes far beyond a single statistic. It reflects how dramatically the balance of power has shifted in Austin's property market, and why understanding this metric matters whether you are buying, selling, or simply monitoring the austin housing market.
What Is the Absorption Rate and Why Does It Matter?
The absorption rate is calculated by dividing the number of homes sold in a given month by the number of active listings available. The result is expressed as a percentage, and it offers a straightforward lens into market dynamics. When more than 20% of active listings sell in a given month, conditions favor sellers — demand is strong relative to supply. When that ratio falls below 10%, the market tilts decisively in favor of buyers, indicating weak demand and an oversupply of homes sitting on the market. The range between 10% and 20% represents a transitional zone where neither side holds a commanding advantage.
In February 2026, Austin recorded a 15% absorption rate, calculated from 2,064 homes sold against 13,516 active listings. This places the austin housing market in that buyer-leaning transition zone, well below the seller-favored threshold and moving closer to outright buyer's market territory than at any point in recent history.
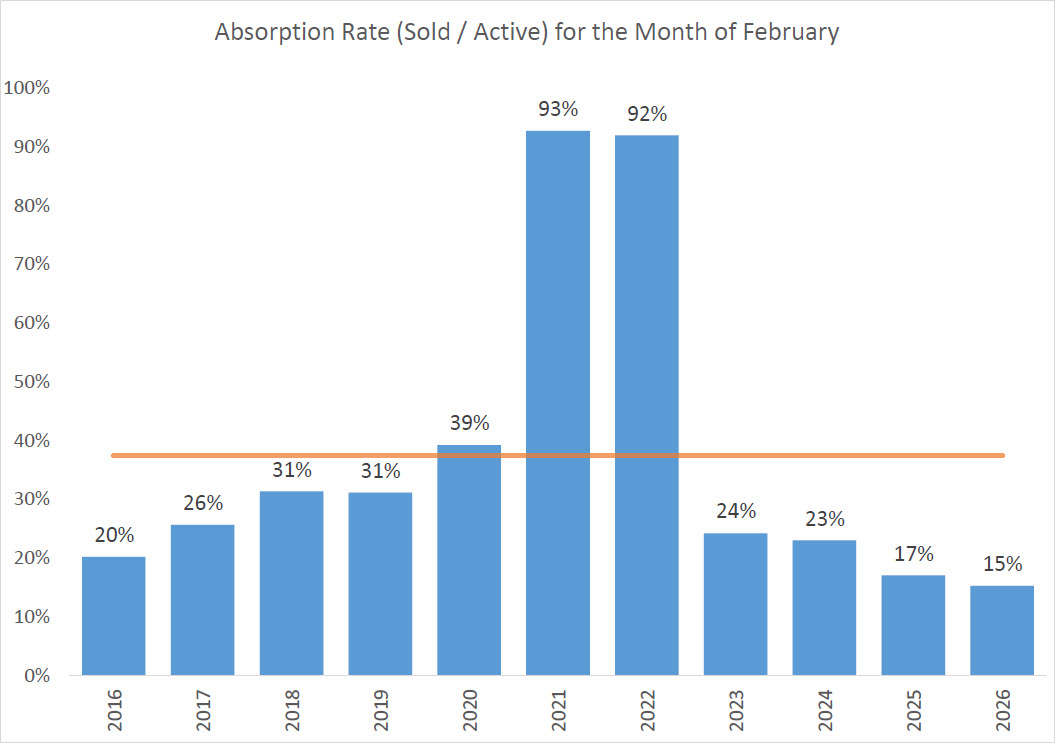
From 93% to 15%: A Market Transformation in Five Years
To fully appreciate what the February 2026 data represents, it is essential to look at where this market has been. In February 2021, at the peak of the pandemic-era buying frenzy, Austin's absorption rate reached 93% — the highest February reading on record. That month, there were only 2,694 active listings in the entire market, and 2,498 of those homes sold. Supply was so thin and demand so intense that nearly every available home was finding a buyer within the month. The austin real estate market during that period was unlike anything seen before or since.
By February 2022, the rate remained nearly as extreme at 92%, confirming that the frenzy was not a one-month anomaly. Then the correction began. By February 2023, the absorption rate had fallen to 24%, and in February 2024 it slipped further to 23%. February 2025 brought it down again to 17%, and now February 2026 has established a new floor at 15%.
The contrast in raw inventory numbers makes this shift even more vivid. Active listings have grown from 2,694 in February 2021 to 13,516 in February 2026 — an increase of more than 400%. Meanwhile, the number of homes sold actually declined, from 2,498 in February 2021 to 2,064 in February 2026. More homes on the market, fewer homes selling. That combination is the fundamental driver behind the absorption rate's continued decline in the austin real estate market.
Historical Context: Below Pre-Pandemic Norms
The current 15% absorption rate does not just stand out against the pandemic-era peaks — it sits below every February reading going back to 2016. In the years before the pandemic, Austin's February absorption rates ranged from 20% in 2016 to 31% in both 2018 and 2019, with a notable jump to 39% in February 2020 just before the market went vertical. Even the pre-pandemic range, which already reflected a relatively healthy and balanced market, is now well above where Austin stands today.
An orange reference line drawn across the chart at approximately 38% represents the longer-term contextual benchmark for this data series, and the February 2026 reading of 15% sits far below it. The austin real estate forecast implied by this trajectory is one of continued buyer leverage, as long as inventory remains elevated and the pace of sales fails to accelerate meaningfully.
What This Means for Austin Buyers and Sellers
For buyers, the current austin housing trends represent a genuine opportunity. With 13,516 active listings competing for a pool of roughly 2,064 monthly buyers, sellers are under real competitive pressure. Buyers have more room to negotiate on price, inspection repairs, closing costs, and contingencies than at any point since the mid-2010s. The austin property market is rewarding patience and preparation in a way that was simply not possible during the 2021 and 2022 boom years.
For sellers, the 15% absorption rate is a clear signal that pricing strategy and presentation are more critical than ever. Homes that are priced to reflect current market conditions and show well are still selling — 2,064 transactions in a single month is not a trivial number. But overpriced listings are sitting, and the data confirms that the days of receiving multiple offers above asking price within the first weekend are, for most sellers, behind them. The austin real estate report for February 2026 asks sellers to align expectations with the data rather than with memories of a market that no longer exists.
The Trajectory Ahead
The austin real estate trends embedded in this absorption rate data suggest that the market has not yet found its floor. Every February from 2023 through 2026 has produced a lower absorption rate than the year before, and nothing in the current data indicates that trend is about to reverse sharply. For the absorption rate to climb back above the 20% seller-favorable threshold, Austin would need to either see a meaningful reduction in active inventory, a significant increase in the pace of sales, or both simultaneously.
What this austin real estate forecast ultimately reveals is a market in the process of normalizing — working its way back to balance after an extraordinary run of speculation and demand-driven price appreciation. The 15% February 2026 reading is the clearest evidence yet that the correction is deep, measured, and ongoing. For stakeholders across the spectrum, from first-time buyers to seasoned investors to listing agents, the absorption rate is the single most honest indicator of where the austin market stands right now.
Frequently Asked Questions
What does Austin's 15% absorption rate in February 2026 mean for homebuyers?
A 15% absorption rate means that only 15 out of every 100 active listings sold during February 2026, reflecting significantly more supply than demand in the austin real estate market. For buyers, this translates to increased negotiating power, less urgency to waive contingencies, and more time to make informed decisions. With 13,516 active listings and only 2,064 homes sold that month, buyers have the widest selection and least competition seen in Austin in over a decade. This austin housing market environment is distinctly more favorable to buyers than the historic highs of 2021 and 2022, when absorption rates of 93% and 92% left buyers with virtually no leverage. Austin real estate trends suggest buyers should take advantage of current conditions while inventory remains elevated.
How does Austin's absorption rate compare to its historical average?
Based on the available February data from 2016 through 2026, Austin's absorption rate has ranged from as low as 15% (February 2026) to as high as 93% (February 2021). Pre-pandemic February readings between 2016 and 2020 averaged roughly 29%, and even those years were considered a seller-favorable market given the 20% threshold. The current 15% reading in the austin property market sits below every previous February in the dataset, making it the weakest absorption reading on record for this month. The broader austin real estate report context makes clear that the current market represents a structural shift, not just a short-term dip.
Why has Austin's housing inventory increased so dramatically since 2021?
Active listings have surged from 2,694 in February 2021 to 13,516 in February 2026, an increase of more than 400%, driven by a combination of rising interest rates, affordability constraints, and a wave of new construction adding supply to the austin real estate market. Higher mortgage rates that began rising in 2022 priced many potential buyers out of the market, reducing the pool of qualified demand even as more sellers listed and builders continued delivering new homes. Additionally, some investors who purchased during the 2021 peak began returning properties to the market as appreciation stalled. The result is the inventory-heavy environment that now defines austin housing trends heading into mid-2026.
Is Austin's real estate market turning into a buyer's market?
The February 2026 absorption rate of 15% places the austin real estate market in the transitional zone below the 20% seller-threshold but above the 10% level that signals a full buyer's market. By this measure, Austin is buyer-leaning but has not yet crossed into outright buyer's market territory. However, the consecutive year-over-year declines in absorption rate from 2023 through 2026 show a clear directional trend, and if current inventory levels persist while sales volumes remain around 2,000 per month, further movement toward a buyer's market is possible. Austin real estate trends point toward continued normalization rather than a sudden reversal.
What is a good absorption rate in real estate, and how does Austin measure up?
In real estate analysis, an absorption rate above 20% generally indicates a seller's market with strong demand relative to available supply, while a rate below 10% signals a buyer's market with weak demand and excess inventory. A rate between 10% and 20% represents a transitional or balanced market. Austin's current 15% reading falls in this middle zone, though the consistent downward trend over the past four Februaries reflects ongoing softening. Compared to the austin housing market at its peak in February 2021, when 93% of active listings sold in a single month, today's 15% rate underscores just how dramatically austin real estate has rebalanced since the pandemic-era frenzy.