Austin Real Estate Market 2025: Rising New Listings, Shifting Pending Sales, and a Cooling Inventory Stress Index
The Austin real estate market is a constantly evolving ecosystem where the interplay of supply and demand shapes opportunities for buyers, sellers, and investors. The Inventory Stress Index (ISI) is a key tool that measures the pressure on available homes by comparing active listings (homes for sale) to pending sales (homes under contract). Recent data from 2000 to April 2025 highlights a surge in new listings and a complex trend in pending sales, with real estate agents reporting an anticipated 20% increase in pending sales following a period of decline. These shifts have driven the ISI to a record low, signaling a buyer-friendly market in Austin. This article explores these trends, grounded in detailed data, to provide clear insights for stakeholders.
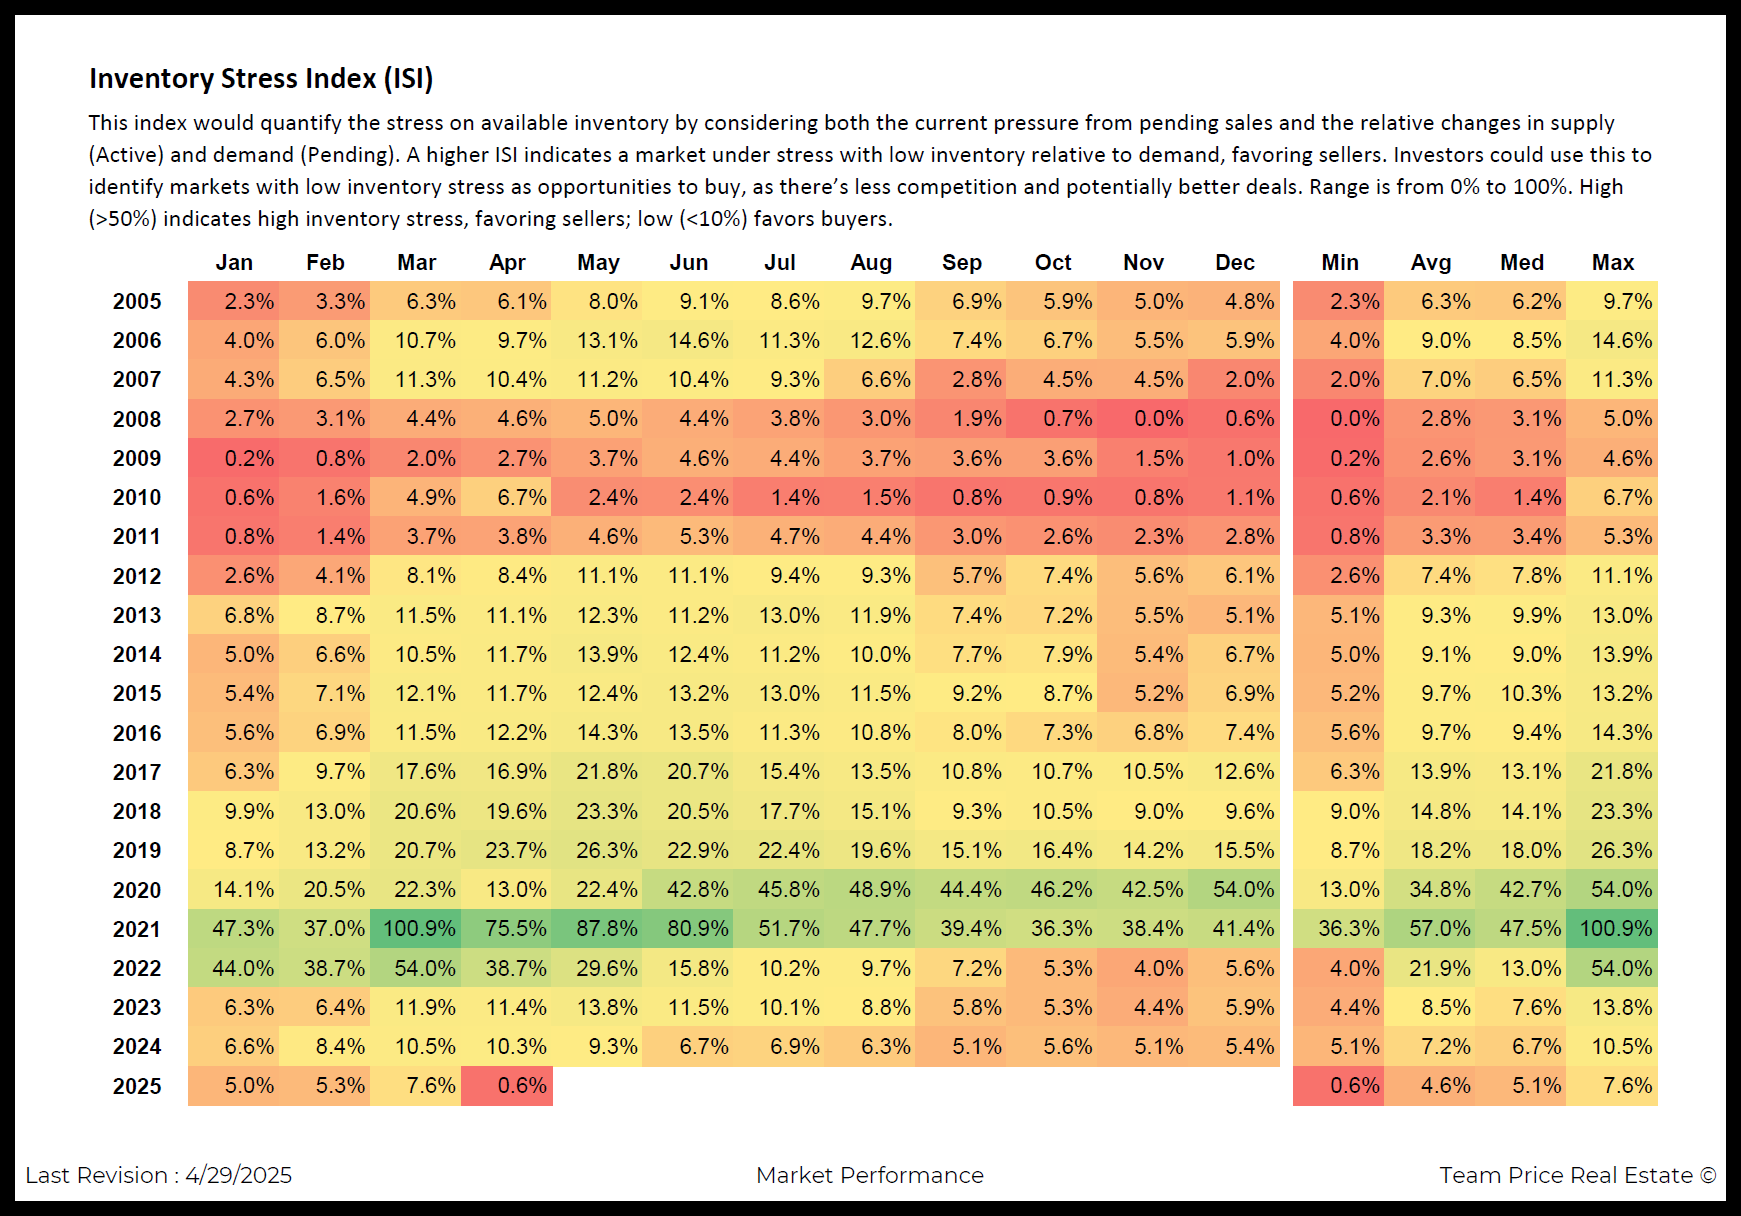
The ISI, ranging from 0% to 100%, quantifies inventory stress by analyzing the balance between active and pending listings. An ISI above 50% indicates a seller’s market with low inventory and high competition, while an ISI below 10% suggests a buyer’s market with ample homes and reduced demand. Historical data reveals significant shifts in Austin’s market. In 2005, the ISI averaged 6.3%, peaking at 9.7% in August with 3,446 new listings and 1,490 pending sales. In contrast, 2021 marked an extreme seller’s market, with the ISI soaring to 100.9% in March, driven by 5,693 pending sales and just 2,129 active listings. In 2024 and early 2025, the ISI has trended downward, averaging 7.2% in 2024 and plummeting to 0.6% in April 2025, largely due to a surge in new listings and a temporary dip in pending sales.
New listings, representing homes newly added to the market, have significantly eased inventory stress. In 2024, new listings climbed steadily, reaching 5,363 in April and hitting 5,637 in April 2025. This growth contrasts with 2021, when April saw 4,663 new listings amid intense demand. For context, in April 2000, Austin had 2,226 new listings and 11,034 active listings, resulting in an ISI of 2.3%. The recent spike in new listings—5,348 in March 2025 and 5,637 in April 2025—has increased active listings to 14,145 in April 2025, the highest since June 2024 (13,827). This influx of homes has outpaced demand, contributing to the low ISI, even as pending sales are expected to rebound.
Pending sales, which reflect homes under contract, have seen a notable decline but are poised for recovery. In April 2024, pending sales totaled 2,113, but by April 2025, they fell to 1,595, down from 2,325 in April 2021 during the market’s peak. This drop, combined with 14,145 active listings, produced a high active-to-pending ratio of 8.86 and an ISI of 0.6% in April 2025. However, real estate agents report that pending sales are expected to rise by approximately 20%, increasing from 1,595 to around 1,914 in the near term. This projected increase, if realized, could raise the ISI slightly but is unlikely to push it above 10%, given the high volume of active listings. For comparison, in June 2020, pending sales reached 2,320, contributing to an ISI of 42.8% amid post-pandemic demand surges.
The combination of rising new listings and fluctuating pending sales has reshaped Austin’s market dynamics. In 2023, the ISI averaged 8.5%, with 4,167 new listings and 2,223 pending sales in April. By 2024, new listings rose to 5,363 in April, while pending sales dropped to 2,113, lowering the ISI to 10.3%. In April 2025, the record 5,637 new listings and 1,595 pending sales drove the ISI to 0.6%. Even with a projected 20% increase in pending sales to 1,914, the active-to-pending ratio would remain high at approximately 7.39 (14,145 active listings divided by 1,914 pending), indicating a market still favoring buyers. This ratio is notably higher than April 2021’s 1.17 (2,731 active to 2,325 pending), underscoring the current surplus of inventory.
Historical trends provide context for these shifts. In 2008, during the financial crisis, the ISI averaged 2.8%, with 4,325 new listings and 1,099 pending sales in April, reflecting low demand and high supply. Similarly, in 2011, the ISI averaged 3.3%, with 3,652 new listings and 1,217 pending sales in April. These low-stress periods align with economic slowdowns, much like early 2025, where 5,637 new listings and an initial 1,595 pending sales suggest a cooling market. The anticipated 20% rise in pending sales to 1,914 could mirror trends seen in 2012, when the ISI rose to 7.4% with 3,579 new listings and 1,275 pending sales in April, indicating a gradual demand recovery.
Seasonal patterns also influence these dynamics. Spring months like March and April typically see higher new listings, as evidenced by 4,963 in March 2024 and 5,637 in April 2025, as sellers aim to capitalize on peak buying seasons. The decline in pending sales from 2,101 in March 2025 to 1,595 in April 2025 suggests buyer hesitation, possibly due to affordability challenges or interest rate fluctuations. However, the projected 20% increase in pending sales to 1,914 could signal renewed buyer interest, similar to spring 2018, when the ISI reached 19.6% with 1,818 pending sales and 4,640 new listings.
For stakeholders, these trends offer actionable insights. The low ISI of 0.6% in April 2025, driven by 5,637 new listings and 1,595 pending sales, indicates a market with abundant inventory and reduced competition. Even with a projected 20% rise in pending sales to 1,914, the high active-to-pending ratio suggests buyers will continue to have more choices and negotiation power, akin to 2009’s average ISI of 2.6% with 3,522 new listings in April. Sellers may face longer selling times, particularly with 14,145 active listings, while agents can leverage this data to guide pricing and timing strategies. Investors may find opportunities in this low-stress market, where deals are more accessible, despite the expected uptick in pending sales.
Austin’s real estate market is at a pivotal moment, shaped by a surge in new listings and a shifting demand landscape. The significant increase in new listings to 5,637 in April 2025, coupled with a temporary decline in pending sales to 1,595 and an anticipated 20% rise to 1,914, has driven the ISI to historic lows. By understanding these data-driven trends, stakeholders can navigate the market with clarity, whether buying, selling, or investing in Austin’s dynamic housing landscape.
FAQ Section
What is the Inventory Stress Index (ISI) in real estate?
The Inventory Stress Index (ISI) measures the pressure on available home inventory by comparing active listings to pending sales. Ranging from 0% to 100%, a high ISI (above 50%) indicates a seller’s market with low inventory, while a low ISI (below 10%) signals a buyer’s market with more homes. In April 2025, Austin’s ISI was 0.6%, driven by 5,637 new listings and 1,595 pending sales, though agents project a 20% rise in pendings to 1,914.
Why are new listings increasing in Austin’s real estate market?
New listings in Austin are rising due to seasonal trends, seller activity, and market conditions. In April 2025, new listings reached 5,637, up from 5,363 in April 2024, as sellers listed more homes during the spring season. This surge, alongside an initial 1,595 pending sales, lowered the ISI to 0.6%, though a projected 20% increase in pending sales to 1,914 may slightly shift dynamics.
How does a change in pending sales affect Austin’s housing market?
Changes in pending sales impact inventory stress and market balance. In April 2025, pending sales dropped to 1,595, contributing to a low ISI of 0.6% and a high active-to-pending ratio of 8.86. Agents report a 20% rise to 1,914 pending sales, which could increase the ISI slightly but maintain a buyer-friendly market with 14,145 active listings, offering buyers more options and sellers longer selling times.