Austin's New Listing to Pending Ratio Is Signaling a Spring Shift for 2026
Something is quietly changing in the Austin real estate market. After a year in which the New Listing to Pending Ratio spent most of 2025 well below its historical average, early 2026 data is showing a meaningful improvement — and the timing couldn't be better. With spring listing season underway and mortgage rates sliding toward 5.98%, the data suggests Austin's housing market is building momentum it hasn't had in over a year.
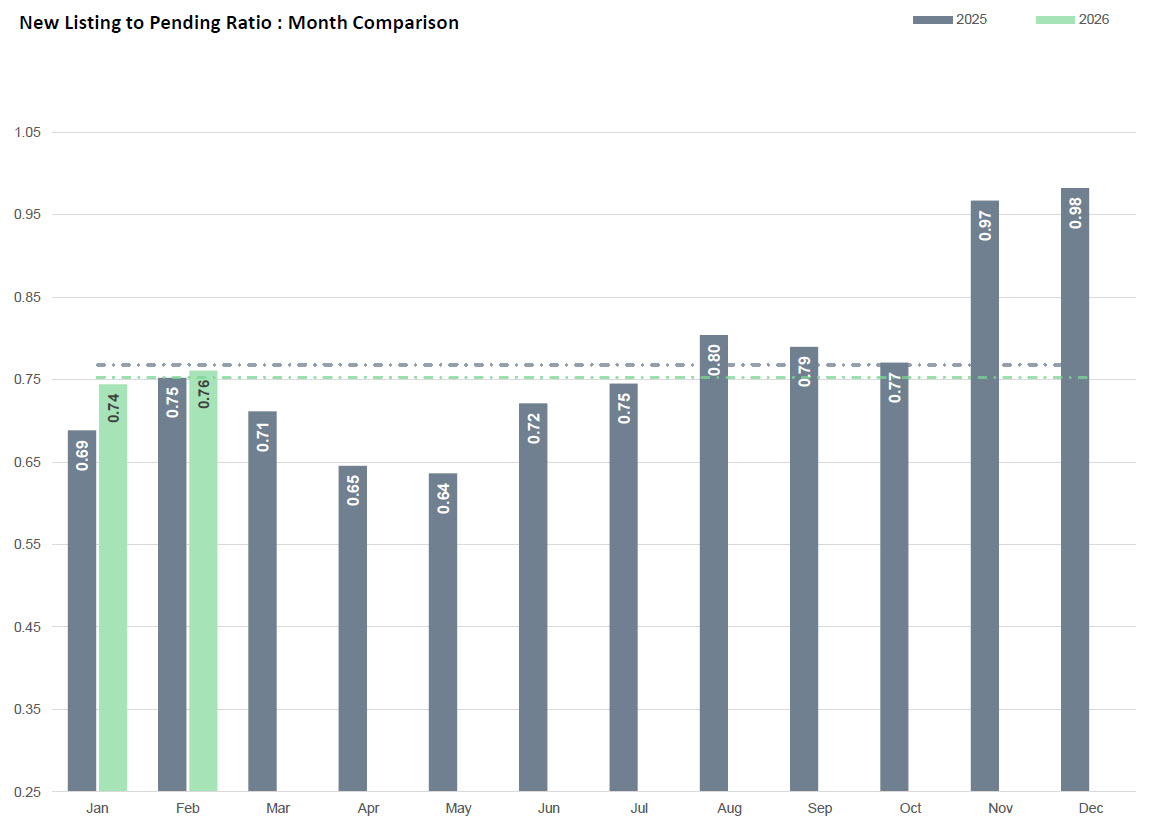
The New Listing to Pending Ratio for February 2026 came in at 0.76, up from 0.75 in January. More importantly, both months are running ahead of the same period in 2025, when January posted 0.69 and February registered 0.75. That year-over-year improvement, while modest in absolute terms, is the clearest early signal that demand is gaining ground on supply as we enter the most active selling season of the year.
What is the New Listing to Pending Ratio? This metric divides new listings by pending contracts in a given period. A ratio below 1.0 means fewer homes are going under contract than are being listed — supply is outpacing demand. A ratio above 1.0 means the reverse. The lower the ratio, the more competitive the market for buyers.
Where the Ratio Stands — and What History Says
At 0.76, Austin's New Listing to Pending Ratio sits below the 25-year historical average of 0.82. That means the market remains structurally tilted toward buyers — there are more homes available than contracts being written. But the direction of travel matters as much as the absolute number, and right now the direction is favorable.
For context, the ratio collapsed from 1.32 in January 2022 to 0.58 by June of that year — the sharpest single-year correction in the dataset — as the Fed's rate hikes hit the market. The ratio spent much of 2023 and 2024 slowly recovering. The full-year 2025 ratio landed at 0.74. The fact that 2026 is already running at 0.75 through the first two months, and trending upward, is a meaningful departure from last year's trajectory.
Historically, the ratio follows a predictable seasonal pattern: it tends to bottom out in spring as new listings flood the market, then recover through the second half of the year as listing volume drops and pending contracts hold steady. In 2025, the spring dip bottomed at 0.64 in May. If 2026 follows a similar seasonal pattern but from a higher starting point, the full-year ratio could outperform 2025 meaningfully — a significant indicator for market health.
The Three Data Points Driving the Improvement
The ratio doesn't improve in isolation. Three underlying metrics explain why 2026 is starting ahead of 2025.
First, pending contracts are recovering. February 2026 total pending came in at 3,598 — up 3.7% year-over-year and running 14.9% above the long-term average. That means buyers are actively writing contracts, not sitting on the sidelines. The cumulative pending count for January through February 2026 stands at 6,790, up 3.0% from the same period last year.
Second, mortgage rates are falling. The most recent weekly mortgage rate reading is 5.98% — down from 6.65% in March 2025. That's a 67 basis point decline in one year. For a buyer purchasing at Austin's median price point, that rate reduction translates to a meaningful drop in monthly payment, and the data suggests buyers are responding. When rates dropped through the 6.0% threshold in the most recent week, it marked a psychologically significant level not seen since early 2023.
Third, new listings are growing at a manageable pace. February 2026 new listings came in at 4,082, up just 2.2% year-over-year — a much slower rate of supply growth than the market was absorbing in 2023 and 2024. When supply grows slowly and demand grows faster, the ratio improves. That is precisely what the data is showing right now.
The Counterweight: Supply Is Still Elevated
A balanced read of this data requires acknowledging what hasn't changed. Active listings in February 2026 stand at 11,622 — up 3.7% year-over-year and sitting 40.3% above the long-term historical average. There is still a substantial amount of inventory on the market relative to historical norms, and that supply overhang is keeping the ratio below 1.0.
The price reduction data reinforces this. The weekly price drop to price increase ratio is currently at 85%, meaning that for every 100 active listings that see a price change, 85 are reductions and only 15 are increases. The monthly Price Drop to Active ratio sits at 43.0% — meaning nearly half of all active listings have seen at least one price cut. Sellers are still competing aggressively for buyer attention.
Withdrawn and expired listings also bear watching. February 2026 saw 944 withdrawn or expired listings — up 17.4% year-over-year and running 26.7% above average. That figure tells the story of sellers who listed, didn't find a buyer at their price, and pulled the home from the market. It is a sign that overpriced listings are not finding takers, even as overall demand improves.
What This Means for Buyers in Austin
For buyers, the current ratio environment is one of the most favorable in recent memory. Active listings at 11,622 — up 40.3% above the long-term average — means there are significantly more choices than in a typical market. Price reductions on 43% of active inventory mean negotiating leverage is real, not theoretical.
The risk for buyers is complacency. As mortgage rates continue falling and the ratio continues improving, the window of maximum buyer leverage will compress. Markets like Round Rock, Kyle, and Jarrell — already posting Activity Index readings above 30% — are not waiting for spring. Competition in those corridors is already elevated, and buyers who delay risk watching their options narrow.
What This Means for Sellers in Austin
For sellers, the 2026 data is genuinely more encouraging than 2025 at the same point in the year. The ratio improvement, the pending growth, and the rate decline all point toward a stronger spring market than the one that materialized last year.
The caution for sellers is pricing discipline. The 85% price reduction ratio and the 17.4% increase in withdrawn listings are direct evidence that the market is not forgiving overpriced homes. Sellers who list at market — not above it — are moving. Sellers who test the ceiling are generating the withdrawn and expired statistics. February 2026 saw 2,000 homes sold, essentially flat year-over-year (+0.3%), which means closings are happening at a steady pace for correctly priced properties.
Spring 2026 is shaping up as a window of opportunity for sellers who price correctly and list now, before the seasonal inventory surge builds further in April and May.
Frequently Asked Questions
What does Austin's New Listing to Pending Ratio of 0.76 mean for the market?
A ratio of 0.76 means that for roughly every four homes listed in February, approximately three went under contract. It signals that supply is still outpacing demand in the Austin housing market, keeping conditions generally favorable for buyers. However, the ratio is improving compared to early 2025, when January posted 0.69 — suggesting the market is gradually tightening as spring demand builds.
Is Austin's housing market improving in 2026 compared to 2025?
Early indicators say yes. The New Listing to Pending Ratio is running above 2025 levels for both January and February 2026. Pending contracts are up 3.7% year-over-year, mortgage rates have fallen from 6.65% to 5.98% over the past year, and new listing growth is modest at 2.2% — all conditions that favor a more balanced market than what buyers and sellers experienced in 2025.
Why are so many Austin homes getting price reductions?
With 85% of price changes being reductions and 43% of active listings having seen at least one price cut, the data reflects a market where active inventory — currently 40.3% above the long-term average — gives buyers leverage. Sellers who price above market are being forced to reduce. This is a function of elevated supply, not collapsing demand, as evidenced by pending contracts running 14.9% above their long-term average.
What is a healthy New Listing to Pending Ratio for Austin?
The 25-year historical average for Austin is 0.82. Ratios above 1.0 represent seller's market conditions, as seen in 2020 (1.10) and 2021 (1.08). Ratios in the 0.75–0.85 range represent a functional but buyer-friendly market. Austin's current reading of 0.76 is just below the historical average, suggesting conditions that are slightly tilted toward buyers but approaching balance as spring demand accelerates.
How do falling mortgage rates affect the New Listing to Pending Ratio?
Lower mortgage rates directly increase buyer purchasing power, which typically drives more pending contracts — the denominator that pulls the ratio down toward and eventually below historical averages. The most recent weekly mortgage rate of 5.98% represents a 67 basis point drop from March 2025's 6.65%. If rates continue declining through spring, the pending contract count should continue rising, improving the ratio and gradually shifting Austin's market toward more balanced conditions.
Data as of March 6, 2026. Published by Team Price Real Estate. For weekly updates on the New Listing to Pending Ratio and full Austin market data, visit teamprice.com/insight-and-statistics.