Why Austin Buyers Are Choosing New Construction Over Resale in 2026
When a buyer can lock in a 30-year fixed rate near 3.99% on a new build while the same loan on a resale home would run closer to 6.25%, the choice stops being about preference and starts being about math.
That dynamic is reshaping the Austin real estate market right now, and the data is unmistakable. As of April 2026, there are 14,969 active residential listings across the Austin metro, with 3,645 of those being new construction and 11,324 being resale homes. On the surface, those numbers look like a market flush with options. But when you look at which segment buyers are actually choosing, a clear pattern emerges that anyone tracking the austin housing market needs to understand.
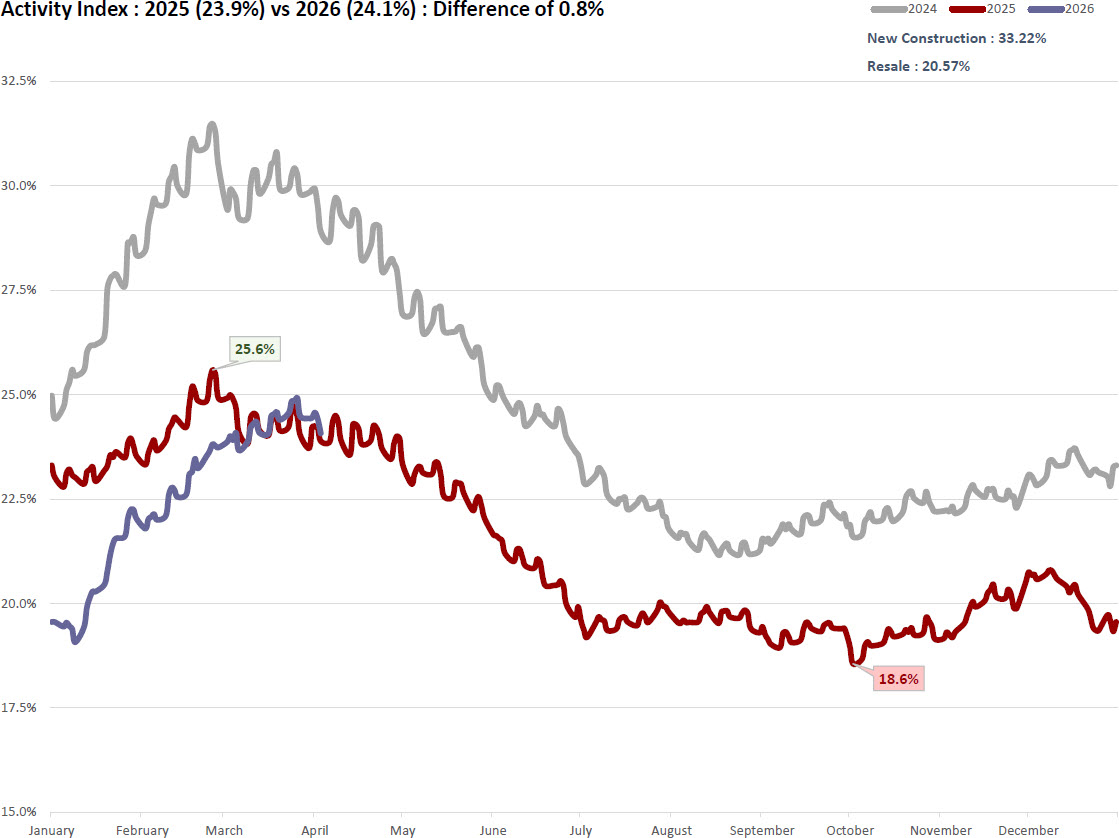
The Activity Index is one of the most useful tools for reading where the market is right now. It measures the percentage of homes that are under contract relative to the total pool of active and pending listings. Think of it as a real-time pulse check on buyer behavior, not a lagging indicator like sold prices, which reflect decisions made 30 to 60 days ago. The higher the Activity Index, the more buyers are actively engaging. The Activity Index for the overall market is 24.1%, a modest gain from 23.9% a year ago. But that overall number masks a sharp split between the two segments. The resale Activity Index sits at 20.57%, placing it squarely in the Softening phase, where sales are slower and inventory is rising. New construction, by contrast, is running at 33.22%, which puts it in the Expansion phase, where demand is strong and prices face upward pressure.
That gap is not an accident. Builders are engineering it. More than 52% of new construction active listings have already received at least one price reduction, compared to 46% across the broader market overall. On top of price adjustments, builders like DR Horton are offering mortgage rate buydowns that bring the effective interest rate to near 3.99% on a 30-year fixed loan. A buyer purchasing a $435,000 home at 3.99% carries a principal and interest payment roughly $600 per month lower than the same purchase financed at 6.25%. Over the life of a loan, that difference is substantial. Builders are not lowering their sticker prices dramatically. They are lowering the monthly cost of ownership, which is what most buyers actually evaluate when making a decision.
This is one of the defining characteristics of the current austin real estate market. Resale sellers are competing not just against other resale homes but against a well-funded builder community that has made it financially easier to buy new than to buy used. That shift shows up in the pending data. Pending listings across the entire market stand at 4,746, up 6.2% from the 4,467 recorded at the same point in 2025. New construction accounts for 1,813 of those pending contracts, representing roughly 38% of all pending activity despite making up only about 24% of active listings. In other words, new construction is generating pending contracts at a disproportionately high rate relative to its share of supply.
For the broader austin housing trends picture, the cumulative data through the first quarter of 2026 is instructive. Cumulative pending contracts reached 11,351 from January through March, which is 4.0% above last year's pace and 14.3% above the long-run historical average. At the same time, cumulative new listings over the same period came in at 13,000, which is down 1.3% year over year even though it remains 27.2% above the long-run average. That combination, fewer new listings entering the market and more contracts being written, is a tightening signal. The New Listing to Pending Ratio for the year currently stands at 0.75, up slightly from 0.74 in 2025, though still below the 25-year average of 0.82.
Resale sellers navigating this environment need to understand the competition they are facing. With 46% of all active resale listings already carrying at least one price reduction, the message from the market is consistent: buyers have leverage, and they are using it. The sold-to-list price ratio for March 2026 came in at 97.28%, which means homes are selling close to their asking prices, but only when those asking prices are grounded in current market reality. Homes that are priced aggressively from the start are finding buyers. Homes that are not are sitting and eventually joining that 46% figure.
The Months of Inventory for the overall market stands at 5.29, up from 5.03 a year ago. Within that figure, there is meaningful variation by city. Cedar Park is running at just 2.90 months of inventory, Pflugerville at 3.86 months, and Round Rock at 3.99 months. These submarkets are operating closer to balanced conditions. At the other end of the spectrum, cities like Dale, Spicewood, Marble Falls, and several Austin ZIP codes are carrying well over 10 months of supply, giving buyers in those areas significant room to negotiate. Investors and agents paying attention to the austin real estate trends by submarket will find that the city-level data is doing more analytical work right now than the metro-wide averages.
The Absorption Rate, which measures the share of active listings that sold in the most recent period, is at 20.32% against a historical average of 31.44%. The Market Flow Score, a composite efficiency measure on a 0 to 10 scale, is at 4.50 compared to a historical average of 6.56. Both metrics confirm that the market is moving, but not quickly, and that the structural advantages still lean toward buyers in most resale segments. For the austin housing forecast heading into the summer months, the question is whether the pending sales momentum being generated now translates into closed sales that stabilize or lift the median price, which currently sits at $435,000 for March 2026, flat year over year and down approximately 20.91% from the May 2022 peak of $550,000.
For investors watching the long-term austin real estate forecast, the projection using the market's 25-year compound appreciation rate of 4.648% suggests the median sold price would not recover to its prior peak until approximately June 2031, assuming the current level represents the market's floor. That is a 64-month timeline from today's reading. It is not a pessimistic forecast. It is simply the math of a correction that ran 20% deep applied to a historical appreciation rate that, over long periods, has been one of the strongest in the country.
The most important data point for agents in the field right now is the Activity Index divergence. A resale market in Softening and a new construction market in Expansion are not just two different numbers. They represent two completely different buyer experiences. Understanding which one your client is entering, and why, is the foundation of useful counsel in the current austin housing market.
FAQ Section
Why are Austin buyers choosing new construction over resale homes in 2026?
The primary driver is the cost of financing, not just the price of the home. Builders in the Austin market are offering mortgage rate buydowns that can bring the effective 30-year fixed rate to near 3.99%, while a comparable resale home in the same area would typically be financed closer to 6.25% under current market conditions. That gap translates to hundreds of dollars per month in payment difference on a median-priced home. The data confirms this preference: new construction carries an Activity Index of 33.22%, placing it in the Expansion phase, while resale sits at 20.57% in the Softening phase. Buyers are responding rationally to the math, and builders have structured their incentive packages specifically to win that comparison.
What is the Activity Index and what does Austin's number mean right now?
The Activity Index measures the percentage of homes in the market that are currently under contract, relative to the total of active and pending listings combined. It is calculated as pending divided by the sum of active plus pending, which makes it a real-time indicator of buyer engagement rather than a lagging measure like sold prices or median values. Austin's overall Activity Index is 24.1% as of April 2026, up slightly from 23.9% a year ago, placing the market in the Softening phase defined as 20% to 25%. A reading above 30% would signal Expansion with rising prices, while a reading below 20% would indicate a contracting market. The fact that the index is ticking upward year over year is a meaningful signal that buyer activity is recovering, even if the pace remains measured.
How much have Austin home prices dropped from their peak?
The Austin housing market has seen a significant correction from its 2022 peak. The median sold price in March 2026 stands at $435,000, which represents a decline of approximately 20.91%, or roughly $115,000, from the May 2022 peak of $550,000. The average sold price of $580,100 has fallen about 14.93%, or approximately $102,000, from its May 2022 peak of $681,939. Using the Austin market's 25-year compound annual appreciation rate of 4.648%, projections suggest it would take until approximately June 2031 for the median price to recover to its prior peak, assuming the market has reached its floor. The pace of year-over-year decline has slowed considerably, with March 2026 median prices coming in flat compared to March 2025, which is a notable change from the steeper drops seen in 2023 and early 2024.
Is the Austin real estate market a buyer's or seller's market right now?
The current austin real estate market broadly favors buyers, though the answer depends significantly on which segment and submarket you are looking at. The resale Absorption Rate is 20.32% against a historical average of 31.44%, and the Market Flow Score of 4.50 is well below the historical average of 6.56, both indicating a market where supply exceeds demand at current pricing. With 46% of all active listings having received at least one price reduction and Months of Inventory at 5.29 across the metro, resale buyers have genuine negotiating leverage in most submarkets. However, new construction is operating in a different environment, with a 33.22% Activity Index in Expansion territory, meaning that segment is moving faster and builder incentives are driving demand in ways that have tightened supply relative to resale. Buyers and agents need to evaluate conditions at the city level, since inventory ranges from under 3 months in Cedar Park to over 35 months in some outer submarkets.
Which Austin suburbs are seeing the most real estate activity right now?
Activity Index data shows Cedar Park at 34.08%, Buda at 32.16%, and Round Rock at 30.16% as the top performers among major suburban markets, all operating at or above the 30% threshold that defines the Expansion phase. These three suburbs are notable because their Months of Inventory readings are also among the tightest in the metro, with Cedar Park at 2.90 months, Round Rock at 3.99 months, and Buda at 5.27 months. At the other end of the spectrum, suburbs like Lago Vista, Burnet, Smithville, and Spicewood are carrying double-digit Months of Inventory and Activity Index readings below 15%, placing them in the Crisis or Contraction phases where buyers have significant leverage. For agents and investors evaluating the austin property market, the suburban divergence in 2026 is as wide as it has been in recent years, making submarket selection one of the most consequential decisions in any transaction strategy.