Austin housing market update : Let’s start with speed: the market’s velocity, also know as the Activity Index (Pending / Active + Pending) — the share of listings under contract—has slowed to 19.68%, well below the historical average of 29.35%. That single metric is the cleanest read on demand right now and frames the current austin real estate environment for buyers, sellers, and investors watching the austin housing forecast.
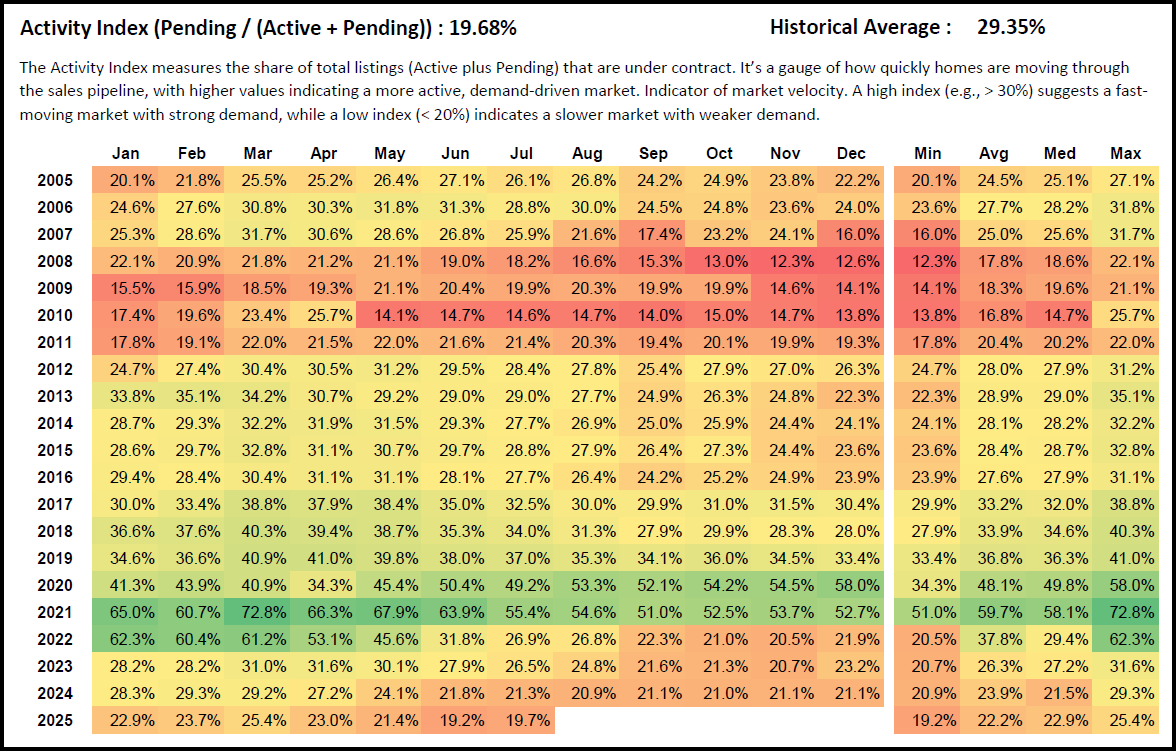
Market velocity at 19.68%: what it means: The Activity Index is simply Pending divided by Active plus Pending. When it pushes above 30%, homes are moving quickly and sellers hold more leverage. When it slips under 20%, the market is slower, buyers have time to evaluate options, and pricing power shifts away from sellers. Today’s reading at 19.68% sits just under that 20% threshold, signaling a slow, buyer-leaning austin real estate market relative to long-term norms.
Year-over-year and month-over-month comparisons : July 2025 registered 19.7% versus 21.3% in July 2024, a decline of 1.6 percentage points, or about 7.5% less activity than the same month last year. Month over month, the Index ticked up from 19.2% in June to 19.7% in July, a modest improvement of 0.5 points, or roughly 2.6%. That uptick matters because it interrupts a steady slide from the March 2025 high of 25.4%, but it does not yet signal a trend change. Compared with that March reading, July’s Index is lower by 5.7 points, about 22% softer, which explains why many listings are taking longer to secure contracts.
Context versus history and the last cycle : Across the full 2005–2025 history, the long-run average is 29.35%. The 2025 year-to-date average through July is 22.2%, which is 7.15 points below the historical norm—about 24% under average market speed. On a cycle basis, 2025’s year-to-date average is also about 14% lower than the same period of 2024. The market has not printed a monthly Activity Index in the “fast” zone above 30% since early 2023. In contrast, 2021’s boom peaked at an extraordinary 72.8% in March, with a full-year average near 60%, and even the more balanced 2013–2016 period commonly ran around 28–32%. By comparison, June 2025’s low of 19.2% is the softest monthly read since 2011. Taken together, this establishes that today’s austin real estate market is operating at a materially slower speed than both the long-term average and the last expansion.
Seasonality still shows up—just muted : Seasonally, Austin typically accelerates from winter into spring and eases through late summer before stabilizing into fall. That pattern showed up in 2025, with a climb from January’s 22.9% to March’s 25.4%, then a steady step-down into June before July’s small rebound. The seasonal cadence is intact, but the amplitude is smaller than normal because demand is lighter. Until the Activity Index sustains readings back into the mid-20s and then breaks above 30%, the austin real estate forecast points to a market that remains price-sensitive and selective.
Reading the index for pricing pressure : Market velocity is a leading indicator of price pressure. When the Activity Index runs near or above 30%, multiple offers and faster absorption often translate into firmer pricing. When it sits near 20%, sellers have to work harder to create urgency, and buyers gain negotiating room on price and terms. With the Index roughly 33% under its historical average today, upward pressure on austin home prices is limited and the balance of risk tilts toward stabilization or selective softness rather than broad price acceleration. That does not mean every list price must fall; it means pricing discipline, condition, and strategy matter more because fewer buyers are moving quickly at any given time.
Where 2025 stands so far : Through July, 2025’s median monthly Activity Index is 22.9%, with a year-to-date range from a 19.2% low to a 25.4% high. Compared with 2024’s calendar-year average of 23.9%, 2025 is running cooler, and compared with 2023’s 26.3%, this two-year slope confirms a gradual normalization from the post-pandemic surge toward a slower, more negotiable austin property market. For planning purposes, assume the back half of the year remains in the low-20s unless we see a sustained rise in pendings relative to actives.
Implications for buyers : For buyers evaluating the austin housing market update, a sub-20% to low-20s Activity Index means more time to analyze properties, more opportunities to negotiate repairs and concessions, and less risk of immediate bidding wars outside of top-tier, move-in-ready listings. The right strategy in this environment is to align search criteria tightly, run side-by-side comps with attention to time on market, and quantify value when a home shows superior condition or location since those are the segments most likely to outperform the averages.
Implications for sellers : Sellers should anchor expectations to market speed rather than headlines. A 19.68% Activity Index reduces the margin for error on pricing and presentation. Listings that match the best of their comps and launch near the true market-clearing price are still going under contract in a reasonable window. Overpricing in a low-velocity market typically results in extended days on market and larger price adjustments later. Monitoring weekly pending-to-active ratios in your segment is the cleanest way to stay ahead of the curve.
Implications for investors : Investors watching austin real estate trends should view the Activity Index as an early-warning system for absorption risk. When velocity softens, carry times lengthen and the importance of conservative purchase underwriting increases. Focus on deal quality, rent realism, and capital structure. The forecast case that fits the data is selective acquisition rather than broad accumulation until the Index lifts back toward the high-20s and demonstrates durability above 30%.
Bottom line for the austin real estate forecast : The market’s speedometer reads 19.68% against a long-run norm of 29.35%. Year over year, July activity is down; month over month, it improved slightly; cycle-to-date, it remains the slowest since 2011 on a monthly low basis. Unless pendings begin to outpace actives for several consecutive weeks, the base case for the austin housing forecast is a slower, buyer-tilted market through late summer with price performance driven at the property level rather than by broad market lift.
FAQ
Is Austin a buyer’s or seller’s market right now?
Based on the Activity Index at 19.68%, Austin leans toward a buyer-friendly environment. Velocity below 20% indicates a slower pace of accepted offers, which typically gives buyers more negotiating power on price, repairs, and concessions. Until the index sustains a move back above 30%, the austin real estate market remains balanced-to-buyer-tilted in most segments.
Are Austin home prices likely to rise or fall from here?
With market speed sitting roughly 33% under the historical average, upward price pressure is limited. In a low-velocity environment, price changes tend to be gradual and property-specific, with well-located and move-in-ready homes holding value better than average. A durable price uptrend usually requires a sustained index above 30%, which the market has not printed since early 2023.
How does 2025 compare with the 2021 boom?
In 2021 the Activity Index routinely ran in the 50s and 60s and peaked above 70%, reflecting extreme demand and rapid absorption. Year-to-date 2025 is averaging 22.2%, less than half that pace. The austin real estate report for 2025 therefore points to longer marketing times and tighter pricing bands versus the frenzy of 2021.
What is the Activity Index and why is it useful?
The Index is Pending divided by Active plus Pending. It measures market velocity by showing the share of total listed inventory that is already under contract. Because it moves before closed sales and prices, it is a practical leading indicator for the austin property market, helping buyers, sellers, and investors anticipate negotiation leverage and timing.
When does activity typically improve during the year?
Seasonally, Austin tends to firm up from winter into spring, then cools into late summer before stabilizing in fall. That pattern showed up in 2025 with a March high and softer reads into June before a slight July bounce. Seasonality still operates, but the current amplitude is muted because overall demand is lighter.