Understanding the Austin Real Estate Market Through the Pending-to-Supply Pressure Index
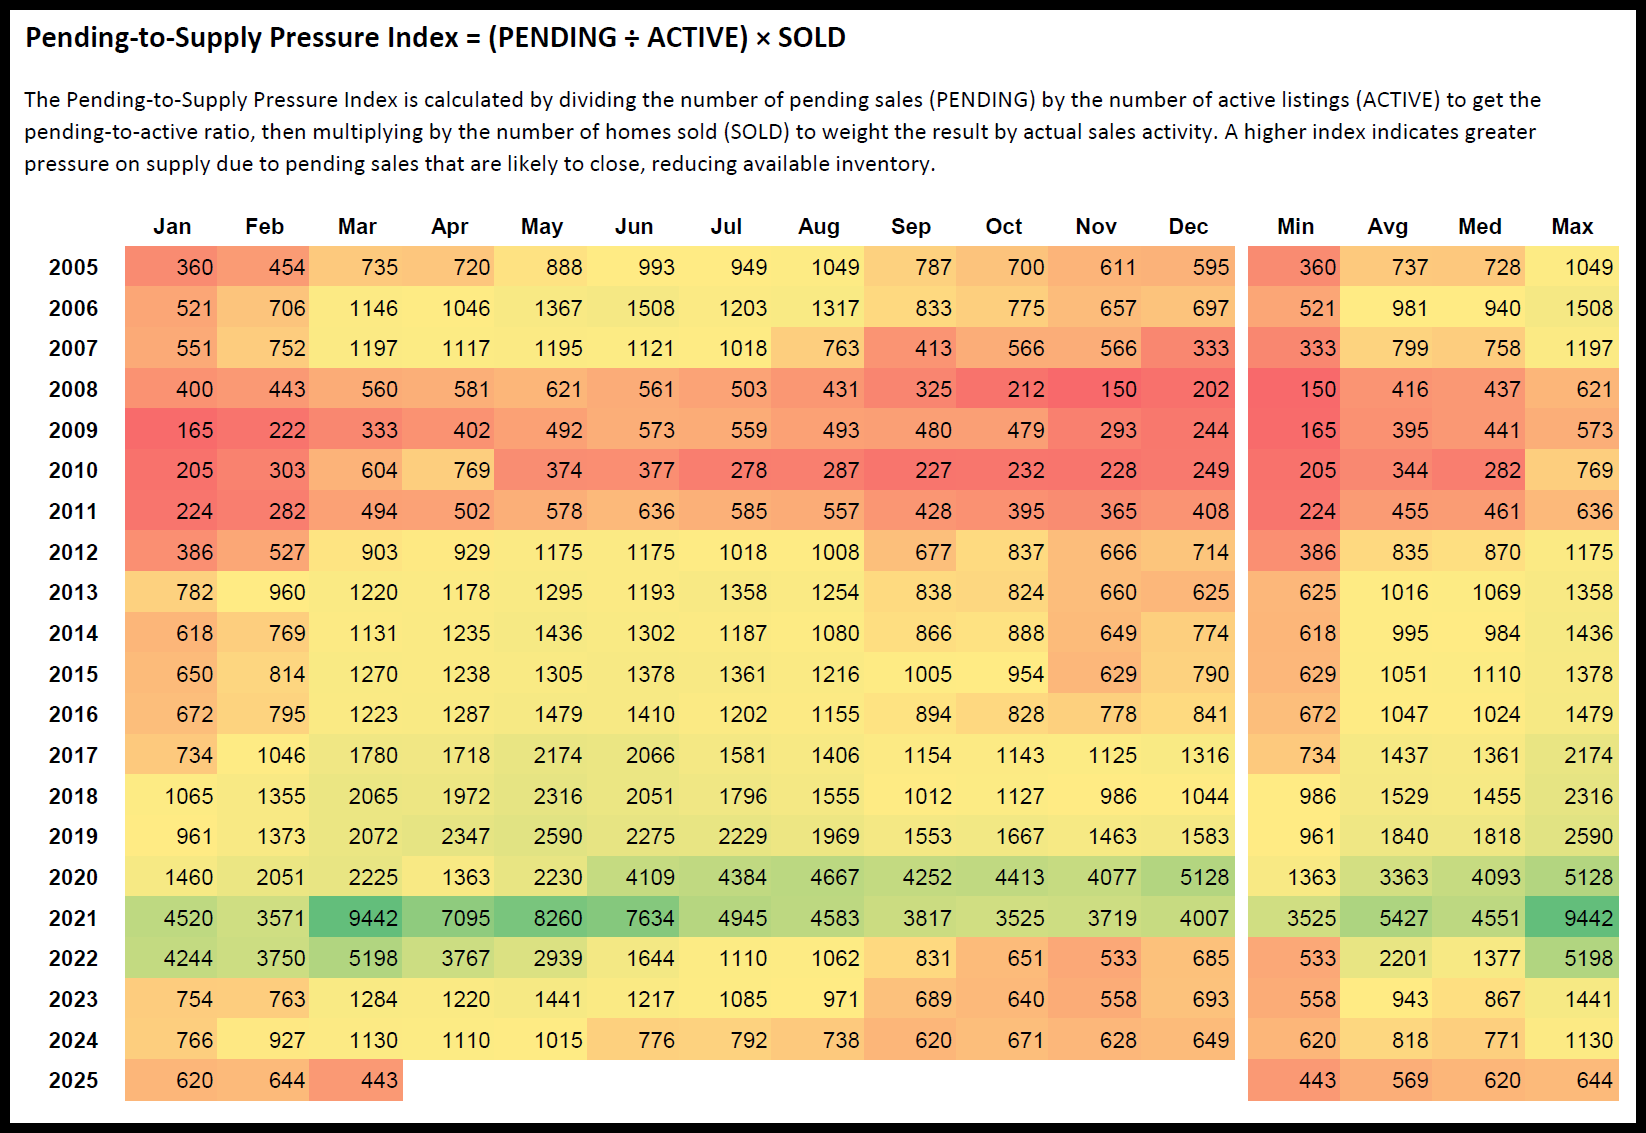
The Austin real estate market has seen its share of ups and downs over the past two decades, and one metric that helps make sense of it all is the Pending-to-Supply Pressure Index. This proprietary measure from Team Price Real Estate, calculated by dividing pending sales by active listings and multiplying by the number of homes sold, reveals how much pressure pending sales put on available inventory. It’s a unique way to see how quickly homes are moving off the market, and the data, updated through March 25, 2025, offers a clear picture of Austin’s housing trends over time.
Think of the Pending-to-Supply Pressure Index like a busy coffee shop. The number of customers waiting in line to order (pending sales) compared to the number of open seats (active listings) shows how crowded it’s getting. Then, multiply that by how many coffees are actually sold (homes sold), and you see how fast the shop’s supply of seats is running out. In March 2021, with an index of 9,442, it was like a packed shop with a long line and no seats left—tons of pressure. But in November 2008, with an index of 150, it was more like a quiet day with plenty of empty chairs and no rush, showing little strain on supply.
Looking back to 2005, the index averaged 737 for the year, with a high of 1,049 in August and a low of 360 in January. This was a relatively stable period, but fast forward to 2008, and the financial crisis hit hard. By November 2008, the index dropped to 150, showing almost no pressure on supply as buyers pulled back. Compare that to March 2021, when the index skyrocketed to 9,442, reflecting a frenzied seller’s market where demand far outstripped supply. That kind of swing shows just how much the market can shift, and this metric captures it all.
The numbers tell a story of peaks and valleys. In 2019, the index hit 2,590 in May, averaging 1,840 for the year, a sign of robust demand. Then 2020 brought a wild ride, with December reaching 5,128 and an annual average of 3,363, fueled by pandemic-driven buying. The frenzy peaked in 2021 with that 9,442 in March and a yearly average of 5,427, but by 2022, things cooled off—May dropped to 2,939, and November hit 533, averaging 2,201 for the year. In 2023, the average fell to 943, with a high of 1,441 in May, and 2024 continued the trend with an average of 818, peaking at 1,130 in March. By early 2025, January sat at 620, February at 644, and March at 443, suggesting a market with less urgency.
What does this mean for Austin’s housing scene? When the index climbs above 1,500—like it did in May 2018 at 2,316 or July 2020 at 4,384—it signals a seller’s market where homes sell fast, and inventory shrinks. Below 500, as seen in January 2009 at 165 or November 2022 at 533, it’s a buyer’s market with more homes than takers. Most years hover between these extremes, like 2016’s average of 1,047 or 2014’s 995, showing a balanced market with steady activity.
This data isn’t just numbers on a page—it’s a tool for anyone navigating Austin real estate. Take 2017, when the index averaged 1,437 and hit 2,174 in May, indicating strong demand that favored sellers. Buyers that year faced stiff competition, especially in spring. Flip to 2010, with an average of 344 and a low of 205 in January, and buyers had the upper hand as supply lingered. Even recent years like 2023, with a median of 867, or 2024, with a median of 771, show a market easing from the highs of 2020 and 2021, giving buyers more breathing room.
Team Price Real Estate’s Market Performance Metrics, where this index lives, is part of a broader set of analytics. Their Market Performance section at https://teamprice.com/market-performance features 11 other reports, all updated daily, to track and forecast Austin’s market with precision. Whether you’re buying, selling, or advising clients, these insights cut through the noise. The Pending-to-Supply Pressure Index stands out because it ties pending sales directly to inventory pressure, offering a real-time snapshot of where the market’s headed.
Looking at specific moments, like May 2016’s 1,479 or December 2018’s 1,365, you see how seasonal trends play in. Spring often brings higher pressure—March 2019 hit 2,072—while late fall can ease off, like November 2014 at 649. The extremes, though, really stick out: that 9,442 in March 2021 dwarfed the 150 in November 2008, showing how fast Austin can swing from buyer-friendly to seller-driven. Even in 2025, with March at 443, the market feels quieter than the 5,128 peak of December 2020.
This proprietary data from Team Price Real Estate isn’t just for insiders—it’s a window into Austin’s housing pulse. Whether you’re tracking the climb from 360 in January 2005 to 1,049 in August or the drop from 9,442 in March 2021 to 325 later that year, the Pending-to-Supply Pressure Index lays out the market’s rhythm. It’s a detailed, data-driven guide for anyone wanting to understand inventory dynamics in one of America’s most watched real estate markets.
FAQ Section
Q: What is the Pending-to-Supply Pressure Index in real estate?
A: The Pending-to-Supply Pressure Index is a metric that measures pressure on housing inventory by dividing the number of pending sales by active listings and multiplying by the number of homes sold. It shows how pending sales, which are likely to close, reduce available supply. In Austin, Team Price Real Estate tracks this index, with data from 2005 to March 2025 showing highs like 9,442 in March 2021 and lows like 150 in November 2008.
Q: How does the Pending-to-Supply Pressure Index affect home buyers?
A: When the index is high, like 2,590 in May 2019 or 9,442 in March 2021, buyers face a tight market with fewer homes and more competition, often driving prices up. A low index, such as 165 in January 2009 or 443 in March 2025, means more inventory and less pressure, giving buyers more options and negotiating power.
Q: Why is the Austin real estate market so volatile?
A: Austin’s market fluctuates due to factors like economic shifts, population growth, and demand surges. The Pending-to-Supply Pressure Index captures this, showing a peak of 9,442 in March 2021 during a buying boom and a drop to 150 in November 2008 after the financial crisis. Seasonal trends and external events, like the 2020 pandemic spike to 5,128 in December, also play a role.