Austin investors just got something they haven’t seen in a while: a wider yield spread between real estate and “risk-free” cash.
Austin Real Estate Market Overview
The six-month U.S. Treasury bill is printing near 3.98% today, with real-time quotes hovering around 3.98% to 3.99% intraday. That’s materially below where short rates sat most of the past year and aligns with the Treasury’s latest published six-month constant-maturity close of 4.01% on August 29. Compared with roughly 4.9% a year ago, the short end of the curve has eased by about a full percentage point, narrowing the bar an investment property has to clear to beat cash.
Cap Rates vs. the Six-Month Treasury: Where Austin Outperforms
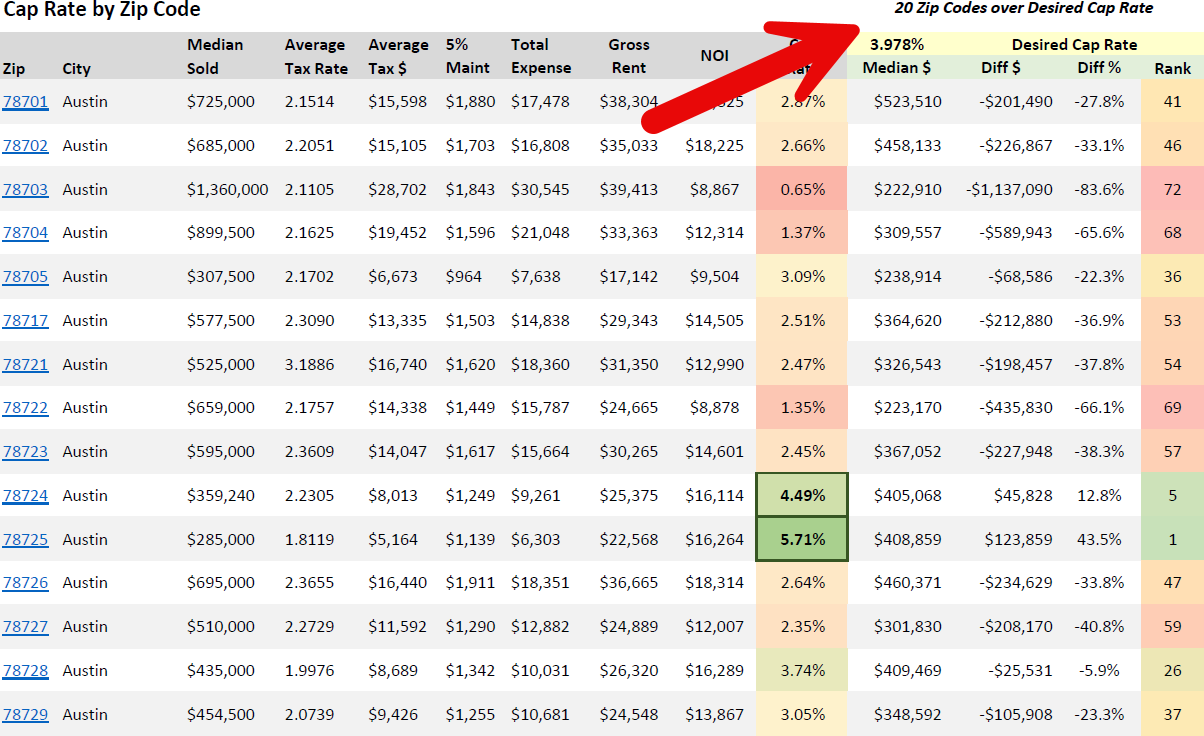
Against that 3.978% six-month benchmark, Team Price’s latest zip-code cap-rate run shows twenty Austin-area ZIP codes now clearing the risk-free hurdle. The strongest spreads are concentrated in the east and far-east submarkets. ZIP 78725 leads at an estimated 5.71% cap rate, which is about 1.73 percentage points above the six-month T-bill. ZIP 76537 follows at approximately 5.05%, or a 1.07-point spread. Several additional areas, including 78616, 78640, and 78724, are posting 50 to 60 basis points of excess yield over cash. On the other end of the spectrum, some ZIPs are only marginally above the Treasury. For example, 78665 is essentially flat to the benchmark at about 3.98%, while 78753, 78741, 78634, and 78666 clear by 1 to 13 basis points. Across all twenty outperformers, the median spread is roughly 32 basis points, the average is about 38 basis points, and the middle fifty percent of ZIPs are delivering 14 to 46 basis points over cash. This is precisely the kind of yield math that resonates with data-minded investors weighing Austin real estate against a government-guaranteed alternative.
Why These Spreads Matter for the Austin Real Estate Market
When the risk-free rate falls, cap-rate thresholds for buy decisions adjust with it. A property that didn’t pencil at a 4.8% T-bill may now clear at a 4.0% hurdle, especially if rents are stable and operating costs are under control. In practical terms, the current six-month rate gives Austin a tailwind in submarkets where cap rates have already drifted into the mid-4s to low-5s. The widening spread in places like 78725 and 76537 strengthens the buy case for investors who require an income premium above cash while they wait for appreciation catalysts to play out. Where spreads are thin—ZIPs barely above the T-bill—deals must be justified by clear value-add, superior tenant quality, or unusually strong rent-growth prospects. In other words, today’s market rewards precision: if the spread is only a few basis points, underwriting must be airtight.
How to Use This in Client Conversations
Anchor the discussion to the investor’s hurdle rate. Start by stating the current six-month Treasury yield to frame the risk-free baseline, then show the relevant ZIP’s cap rate and the spread in basis points. If the spread is 100 to 170 basis points, the deal is competing effectively with cash; if it is 10 to 40 basis points, the buy thesis must rest on durable NOI, below-market purchase price, or a defined improvement plan. This data-first approach cuts through emotion and sets realistic return expectations in an Austin real estate market where financing costs, insurance, and taxes still compress margins for many properties. Use it to triage inventory quickly, focus tours, and sharpen offers where the yield premium is real.
Where the Opportunities Cluster Right Now
The east-side and southeastern corridors stand out in the current pass, with 78725, 78724, 78754, and 78747 all above cash, along with outer-ring ZIPs such as 78616, 78612, 78621, 78653, and 78640. Investors looking for cash-on-cash stability without betting on cap-rate compression should start there. Markets that only clear the T-bill by a sliver—78665, 78753, 78741, and 78634—require tighter offers or a value-add plan to compensate for limited income premium. Keep in mind that cap rate is an unlevered snapshot; actual cash flow will depend on the debt stack, reserves, and capital plans, but starting with a clean risk-free comparison keeps the conversation objective.
Methodology and Source Notes
Cap rates by ZIP are computed from Team Price’s internal cap-rate model based on recent closed sales, current asking rents, vacancy assumptions, and normalized operating expenses, and are designed for cross-market comparison rather than property-level appraisal. The six-month Treasury reference reflects current intraday quotes around 3.98% and the most recent official six-month constant-maturity close at 4.01% as published by the U.S. Treasury; both series point to a meaningfully lower hurdle than twelve months ago, when the six-month rate sat near the upper-4s.
Training and Tools for Agents
For a refresher on calculating and explaining cap rates, as well as reversing into target price from a desired cap rate, review our Cap Rate guide at resources.teamprice.com/buying/investment-properties/analyzing-investment-properties/cap-rate. That walkthrough includes the formula, a worked example, and a quick calculator so you can test sensitivity to vacancy, taxes, insurance, and HOA variables in front of clients. Use it alongside today’s ZIP-level list to align investor expectations with the current Austin property market and to demonstrate why specific neighborhoods are outperforming the austin real estate risk-free benchmark.
FAQ
Is Austin real estate a good investment right now if the six-month Treasury is near 4%?
It depends on the ZIP and the property’s operating profile. In twenty ZIP codes across the Austin area, cap rates currently exceed the six-month Treasury, which means investors can capture an income premium over cash without relying on appreciation. Where the premium is 100 basis points or more, the austin real estate market case is straightforward; where it is 10 to 40 basis points, underwriting must lean on durable NOI and a clear plan to improve performance.
What is a “good” cap rate in Austin in 2025?
For stabilized one-to-four unit rentals, mid-4s to low-5s are increasingly common in the east and southeast corridors, while inner-core properties may sit lower due to price and tax pressure. A “good” cap rate is one that clears the investor’s hurdle after comparing to the current risk-free rate. In 2025’s austin housing forecast context, that often means prioritizing ZIPs with at least a few dozen basis points of premium over the six-month T-bill.
How do changing interest rates affect the Austin housing market and cap rates?
When short-term rates fall, the required return to beat cash falls with them, which can make more Austin properties acceptable at today’s prices. However, if insurance, taxes, or maintenance outpace rent growth, cap rates can still compress. The austin real estate forecast therefore hinges on two levers moving in opposite directions: easing rates that help underwriting and operating costs that can offset those gains.
Which Austin ZIP codes look best for cash-flow today?
Based on the latest Team Price run, 78725 and 76537 show the strongest spreads over the six-month Treasury, followed by 78616, 78640, and 78724. These areas currently offer the widest income premium relative to cash, which is a useful starting point for tours and offer strategy in the austin property market.
How should I explain cap rate vs. cash flow to clients?
Cap rate measures unlevered return and ignores financing. A property can post a 5% cap rate yet run thin or negative monthly cash flow if the loan terms, reserves, or CAPEX needs are heavy. The best practice in an austin real estate report is to show cap rate for comparability, then layer in debt service, taxes, and reserves to compute cash-on-cash so clients see the full picture.