Austin Housing Market Update: Market Flow Score Shows August Gains
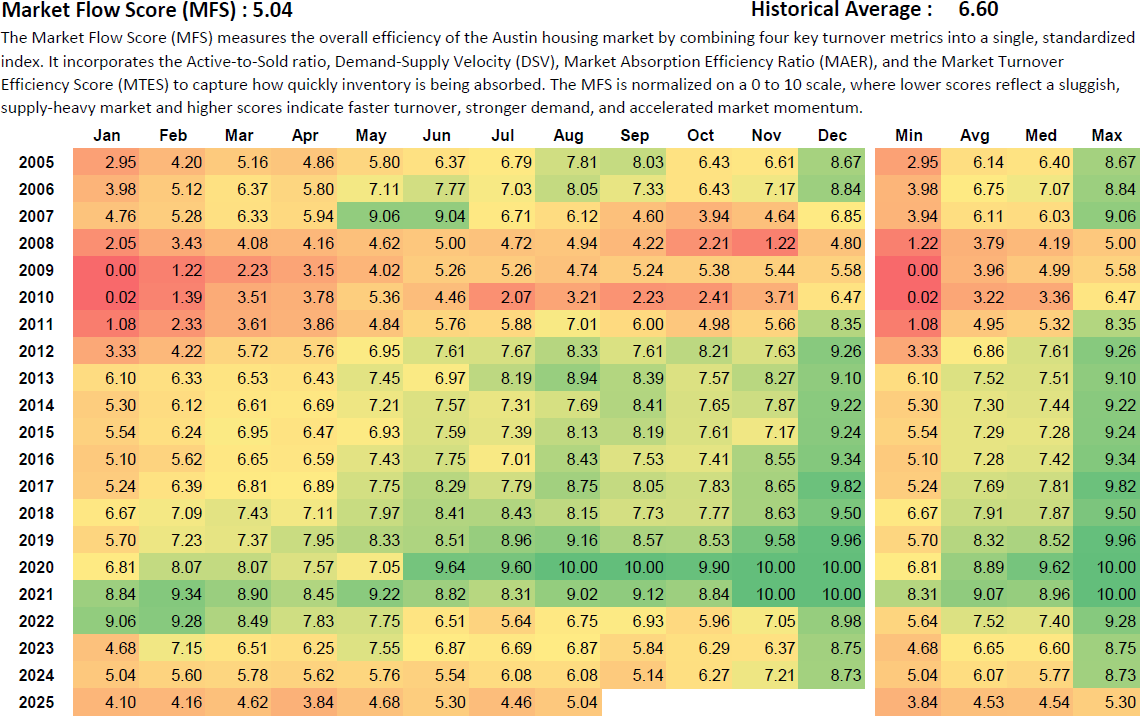
Ever wish you could rate "THE MARKET" between 0 and 10... now you can. The Market Flow Score (MFS) is a standardized index that tracks the overall efficiency of the Austin housing market. It blends key turnover metrics such as the Active-to-Sold ratio, Demand-Supply Velocity, Market Absorption Efficiency Ratio, and Market Turnover Efficiency Score. The MFS normalizes these metrics into a 0–10 scale, where lower numbers reflect a sluggish, supply-heavy market and higher scores indicate strong demand, fast turnover, and accelerating market momentum. In August 2025, the score improved to 5.04, up from 4.46 in July, marking a modest but meaningful shift in efficiency.
Market Flow Score as a Leading Indicator
The Market Flow Score functions as a leading indicator for the Austin real estate market. Unlike home prices, which are a lagging measure since they reflect contracts signed 30–60 days earlier, the MFS captures real-time market dynamics. Historically, the score has shifted ahead of price movements. It surged in 2020–2021 before prices spiked to record highs, and it began declining sharply in early 2022 months before the official price peak in May 2022. This forward-looking characteristic makes the MFS one of the most useful tools for forecasting the Austin housing market.
Based on historical patterns, when the MFS climbs into the upper 75th percentile (7.5 or higher) and sustains that level, prices typically begin rising again within 4–8 months. The faster cycles, like the 2020 surge, showed a lead time of just 4 months, while more balanced markets such as 2013–2017 took closer to 6–8 months. This relationship reinforces why today’s score of 5.04 is significant but still far below the threshold that would reliably signal an upcoming price recovery.
Month-to-Month Performance
The increase from July to August represents a 0.58-point gain, the strongest monthly improvement so far in 2025. Although still low by historical standards, the rise suggests that inventory absorption is starting to stabilize. For much of this year, Austin’s property market efficiency was stuck between 3.8 and 4.6, reflecting sluggish demand. The August score marks the first break above that range, showing signs of renewed momentum.
Year-over-Year Comparison
While the August 2025 score of 5.04 is an improvement, it remains below recent years. Last August registered 6.08, August 2023 measured 6.87, and August 2022 came in at 6.75. This decline underscores how far the market has shifted from its 2020–2021 highs, when August MFS scores regularly exceeded 9.0. In short, today’s efficiency is weaker than both the pandemic boom and the balanced pre-pandemic years.
Historical Context and Price Alignment
August has historically been a high-efficiency month in Austin real estate, with buyers rushing to close before the school year. In 2019, the score hit 9.16, and in 2020 it reached the maximum of 10.0. This year’s 5.04 is nearly half those levels, reflecting how much slower turnover is compared to typical August cycles.
This slowdown is confirmed in the price cycle data. Austin home prices peaked in May 2022, with the average sold price hitting $681,939 and the median at $550,000. By August 2025, the average has fallen to $589,532 and the median to $448,000, representing a 13.5% decline in average prices and an 18.5% drop in median prices from peak. Importantly, the MFS began deteriorating in early 2022, months before these price declines showed up in closing data, proving its role as a leading market signal.
Implications for Buyers and Sellers
For buyers, the lower MFS still means leverage in negotiations, as supply outweighs demand. However, August’s gain indicates that desirable homes are starting to move faster, limiting some of the negotiating flexibility that existed earlier in the year. For sellers, the improvement is encouraging but should be viewed with caution. Efficiency today is still well below historical averages, and prices remain far off peak values. Sellers who align pricing with today’s market realities will see stronger results than those holding out for 2022-level valuations.
Austin Market Forecast
Looking forward, the key question is whether September can sustain or build upon August’s rebound. Historically, September tracks close to August before softening in the fall. If the Market Flow Score continues to rise above 5.0, it will suggest that Austin’s property market is stabilizing after three years of correction. If it falls back, the August improvement will prove seasonal rather than structural. The broader Austin housing forecast points to a prolonged phase of lower efficiency and moderated prices through early 2026, with affordability constraints and high inventory continuing to shape the market.
Frequently Asked Questions
What is the Market Flow Score and why is it important?
The Market Flow Score (MFS) is a 0–10 index that measures how efficiently inventory is being absorbed. It combines multiple ratios to track real-time demand and turnover. Because it shifts ahead of home prices, it is considered a leading indicator of Austin real estate trends and helps forecast upcoming market conditions.
When did Austin home prices peak, and how far have they fallen?
Austin home prices peaked in May 2022, with the average sold price at $681,939 and the median at $550,000. By August 2025, prices have dropped to $589,532 on average and $448,000 median, a decline of roughly 13.5% and 18.5% respectively. These declines align with the Market Flow Score’s earlier downturn.
How much of a leading indicator is the Market Flow Score?
The MFS typically leads price changes by 4–8 months. When the index sustains readings in the upper 75th percentile (7.5 or higher), price growth has historically followed within two quarters. Similarly, when the index weakens, price declines tend to appear 4–8 months later.
Is the Market Flow Score showing recovery in 2025?
Yes, August 2025 posted a score of 5.04, up from 4.46 in July. This is the strongest monthly gain of the year, suggesting seasonal demand lifted efficiency. However, it remains well below the 8–10 range seen in stronger market years, so conditions are still sluggish overall.
What is the Austin housing forecast for 2025 and beyond?
The forecast points to gradual stabilization rather than rapid recovery. If turnover efficiency continues to climb into the fall, Austin may have passed its lowest point in this cycle. Still, affordability challenges and steady listing supply suggest that prices will remain below 2022 peaks into 2026, keeping the Austin property market in a moderated phase.