Every Price Tier in Austin Is Down Year-Over-Year: Upper-Mid Tier Collapses 10.10% While Luxury Holds Flat
City of Austin Residential Market | April 17, 2026 | 4,581 Active Listings
Something unusual is happening in the City of Austin housing market, and it shows up clearly when you stop looking at the median and start looking at the full price distribution. As of Friday, April 17, 2026, there are 4,581 active residential listings inside the Austin city limits, and every single price percentile tracked on sold properties in the trailing 30 days is down year-over-year. Not one tier is positive. Not one. The declines range from a barely-there -0.29% at the top of the luxury market to a striking -10.10% at the 80th percentile. That spread tells a bigger story about the Austin real estate market than any single median figure can.
This Austin housing market update breaks the market into 19 price bands, from the 5th percentile ($225,000) up to the 95th percentile ($2,958,000). Each band reflects what a listing at that point in the distribution actually looks like today in the city of Austin, including list price, price per square foot, monthly PITI payment, and the annual income required to afford it under the 28% rule. The year-over-year column compares the sold price at each percentile band in the last 30 days against the sold price at that same percentile band during the same 30 days a year earlier. It is not a median-to-median comparison. That matters because mix shift, where buyers chase different price points over time, often distorts median headlines. This view controls for that.
The Headline Number: $4,227 a Month for the Median Austin Listing
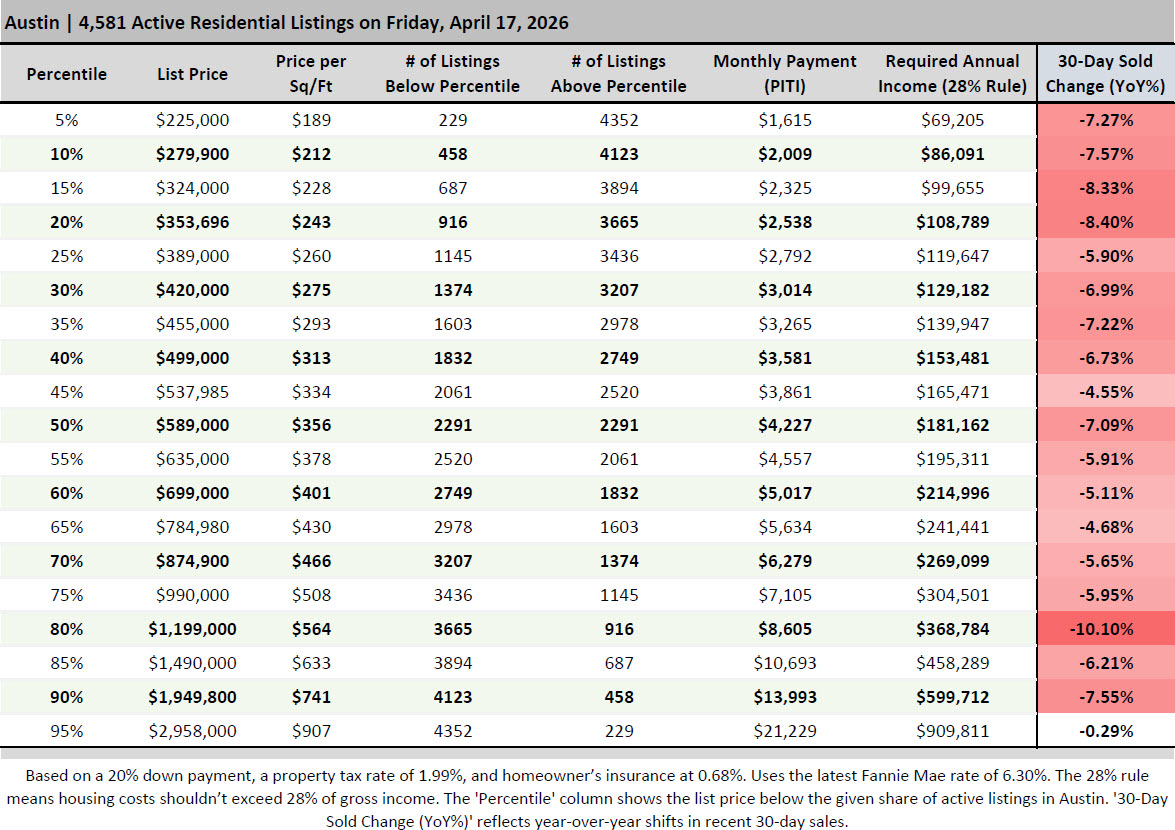
The 50th percentile list price for active listings in the city of Austin sits at $589,000, with a price per square foot of $356. At a 20% down payment, a 6.30% Fannie Mae mortgage rate, a 1.99% property tax rate, and a 0.68% insurance rate, the monthly PITI lands at $4,227. Under the 28% rule, that monthly payment requires an annual gross income of $181,162 to qualify comfortably. There are 2,291 active listings below this price and 2,291 above it, a clean split that confirms this is the true median of what is currently available in the Austin property market.
The year-over-year sold price at the 50th percentile is down 7.09%. That is not the sharpest drop in the distribution, but it sits in the middle of a broadly negative pattern. For context, the median Austin listing a year ago at the same percentile band sold for roughly 7% more than it does today, which translates to real dollars off the closing price of a typical mid-market home.
The Bifurcation Story: Upper-Mid Collapses, Luxury Holds
The most revealing Austin real estate trend in this data is not the average decline. It is the shape of the decline across the price distribution. The steepest year-over-year drop sits at the 80th percentile, which corresponds to a list price of $1,199,000 and a price per square foot of $564. Sold prices at that band are down 10.10% year-over-year, the only double-digit decline in the entire distribution. That single data point suggests the segment of the Austin market most exposed to softening is not the entry level and not the top, but the upper-middle tier where aspirational move-up buyers typically transact.
At the very top of the market, the pattern flips. The 95th percentile list price in the city of Austin is $2,958,000, with a price per square foot of $907. Sold prices at that band are down just 0.29% year-over-year, essentially flat. The monthly PITI at that tier runs $21,229, and the qualifying annual income under the 28% rule is $909,811. The ultra-luxury segment in Austin is behaving as if it operates in a different market entirely, which, given the income required to participate, it effectively does. Buyers at that level are less sensitive to mortgage rates and more responsive to equity and cash positions, which helps explain why this tier is holding pricing when the rest of the distribution is not.
The contrast between -10.10% at the 80th percentile and -0.29% at the 95th percentile is 981 basis points. That is a significant internal bifurcation in a single metro housing market and an important signal for anyone tracking Austin home prices as a uniform trend. They are not moving uniformly.
Entry-Level and Lower-Mid Tiers: Consistent Mid-Single-Digit Declines
The lower half of the Austin housing market, from the 5th percentile through the 45th percentile, shows a fairly tight cluster of year-over-year declines ranging from -4.55% to -8.40%. The 20th percentile ($353,696 list price) and the 15th percentile ($324,000 list price) show the deepest declines in this band, at -8.40% and -8.33% respectively. The 45th percentile ($537,985) shows the shallowest decline at -4.55%. The 5th percentile, which represents the most accessible entry-level listings at $225,000, is down 7.27% year-over-year with a monthly PITI of $1,615 and a required annual income of $69,205.
The consistency of these declines across the lower half of the distribution points to a broad-based softening in the Austin property market rather than a problem confined to a single price point. Entry-level buyers are not getting a dramatically better deal than mid-market buyers, and neither group is seeing prices hold. The 28% rule income requirement for the 20th percentile listing is $108,789, which is still well above the Austin metro median household income, a reminder that affordability remains a structural constraint even as nominal prices drift lower.
The Upper-Mid Squeeze: $874,900 to $1,490,000
The tiers from the 70th percentile through the 85th percentile tell their own story. The 70th percentile list price is $874,900, with sold prices down 5.65% year-over-year. The 75th percentile is $990,000, down 5.95%. Then the 80th percentile at $1,199,000 drops to -10.10%, the sharpest decline in the table. The 85th percentile at $1,490,000 recovers somewhat to -6.21%. This creates a visible trough centered squarely on the million-dollar mark in the city of Austin.
One explanation for this pattern is payment sensitivity. The monthly PITI at the 80th percentile is $8,605, requiring an annual income of $368,784 to qualify under the 28% rule. That income threshold catches a specific slice of the Austin buyer pool, typically dual-income professional households and move-up buyers who are simultaneously selling a prior home. This segment is the most exposed to interest rate friction because they are often carrying existing mortgages at lower rates and face a meaningful payment jump to trade up. When rates stay elevated, as they have with the Fannie Mae benchmark at 6.30%, this cohort tends to sit out, and pricing weakens faster than in tiers where buyers are either less rate-sensitive (luxury) or have no choice but to transact (entry level).
What the Active Listing Distribution Shows
Beyond the year-over-year price changes, the table reveals how active inventory is distributed across the Austin real estate market. Of the 4,581 active listings in the city of Austin, 2,291 are priced below $589,000 and 2,291 are priced above. Roughly 916 listings, or 20% of the market, are priced above $1,199,000. Another 458 listings, or 10%, are priced above $1,949,800. Only 229 listings, or 5%, are priced above $2,958,000.
The concentration of inventory in the $225,000 to $699,000 range is meaningful for buyers. That window, spanning roughly the 5th to the 60th percentile, contains 2,749 listings, more than 60% of the total active market in the city of Austin. For buyers operating in that range, competition is not with scarcity of supply but with other buyers also navigating the same affordability pressure. The required annual income to afford a 60th percentile listing at $699,000 is $214,996 under the 28% rule, which is a non-trivial hurdle even for households with above-average Austin incomes.
Historical Context and the Austin Real Estate Forecast
To put the current data in historical context, the Austin housing market peaked in 2022 before beginning a multi-year correction. Today's data shows that correction is not finished. Every price band is still moving lower year-over-year, and the declines are not concentrated in any single tier. What is different now compared to the earlier phase of the correction is the clear internal bifurcation. The luxury market at the 95th percentile is within rounding distance of flat, which it was not two years ago, while the upper-mid tier around the 80th percentile is showing the sharpest weakness in the distribution.
For the Austin real estate forecast, this distributional view matters more than headline medians. A market where every tier declines at roughly the same rate is behaving as a single market. A market where the 95th percentile is down 0.29% while the 80th percentile is down 10.10% is telling you that demand is fragmenting by income band and that affordability dynamics are not uniform. Buyers and sellers in the city of Austin should read the specific percentile band relevant to their transaction rather than relying on the metro-wide or city-wide median as a proxy.
What This Means for Austin Buyers and Sellers
For buyers, the current data shows that negotiating power exists in every tier of the city of Austin market, but it is not evenly distributed. The 80th percentile tier, around $1.2 million, is where year-over-year comparable sold prices have moved the most in the buyer's favor. The 95th percentile and the 45th percentile are where pricing is holding most firmly, with declines of less than 5%. For buyers with flexibility on price band, understanding which tier is softest is useful.
For sellers, the implication is that listing strategy depends on where a property falls in the distribution. A property listing near the 80th percentile faces the steepest year-over-year pricing headwind, so pricing discipline and presentation matter more than they would in a tier showing a shallower decline. A property in the 95th percentile range is operating in a tier where pricing has barely moved, but the buyer pool is much thinner, which changes the time-on-market dynamic even if the price itself is stable.
The 4,581 active listings in the city of Austin today represent a broad and varied opportunity set. The full Austin real estate report below, laid out by percentile, gives the specific list prices, price per square foot, payment requirements, income requirements, and year-over-year sold changes for each band. This is the level of granularity that the overall median cannot capture, and it is the level of granularity that actually drives transaction decisions in the current Austin property market.
Full Percentile Data: Austin Active Residential Listings, April 17, 2026
The table below shows the complete percentile breakdown for active residential listings inside the City of Austin as of April 17, 2026. The Monthly Payment (PITI) and Required Annual Income columns assume a 20% down payment, a 6.30% Fannie Mae mortgage rate, a 1.99% property tax rate, a 0.68% insurance rate, and the 28% affordability rule. The 30-Day Sold Change (YoY%) column compares sold prices at each percentile band in the trailing 30 days against the sold prices at the same percentile band during the same 30-day window one year earlier.
Frequently Asked Questions
1. What is the current median home price in the City of Austin, Texas?
As of April 17, 2026, the median (50th percentile) list price for active residential listings inside the City of Austin is $589,000, which translates to $356 per square foot. At a 20% down payment with current mortgage rates, the monthly PITI on that property runs $4,227, and the buyer would need an annual gross income of roughly $181,162 to qualify under the 28% affordability rule. Sold prices at this percentile are down 7.09% year-over-year, meaning the typical mid-market Austin home is closing for about 7% less than it did at this time in 2025. This figure reflects the city of Austin specifically and should not be confused with the broader Austin metro area, which includes surrounding cities and tends to show different pricing dynamics.
2. Are Austin home prices going down in 2026?
Yes, Austin home prices are continuing to decline year-over-year across every price tier in the city of Austin as of April 2026. The data shows negative year-over-year changes at all 19 percentile bands tracked, ranging from -0.29% at the 95th percentile ($2,958,000) to -10.10% at the 80th percentile ($1,199,000). The weakness is most pronounced in the upper-mid tier around the $1 million to $1.2 million range, while ultra-luxury properties above $2.95 million are essentially flat. This pattern suggests the Austin real estate market correction that began after the 2022 peak is still in progress, with affordability pressure and elevated mortgage rates keeping downward pressure on most of the distribution.
3. How much income do you need to buy a house in Austin?
The required income depends on the price tier you are targeting in the city of Austin. To afford the 50th percentile listing at $589,000, a buyer needs an annual income of $181,162 under the 28% rule with a 20% down payment. For a more accessible 20th percentile listing at $353,696, the income requirement drops to $108,789. At the 80th percentile ($1,199,000), the required income jumps to $368,784, and at the 95th percentile ($2,958,000), it reaches $909,811. These figures assume a 6.30% mortgage rate, a 1.99% property tax rate, and a 0.68% insurance rate, and they reflect the gross annual income needed to keep housing costs at or below 28% of income.
4. What is the Austin real estate forecast based on current data?
The current data points to an Austin real estate forecast of continued price softness through the near term, with the important caveat that the market is not moving uniformly. The upper-mid tier (roughly 70th to 85th percentile, or $874,900 to $1,490,000) is showing the most weakness, with the 80th percentile down 10.10% year-over-year. The luxury market above $2.95 million is flat. Entry-level and lower-mid tiers are declining at a more consistent mid-single-digit pace. Until mortgage rates ease meaningfully from the current 6.30% Fannie Mae benchmark or incomes catch up to the income requirements embedded in each price tier, the broad pattern of negative year-over-year comparisons is likely to continue in the city of Austin.
5. Why are there so many active listings in Austin right now?
The 4,581 active residential listings in the city of Austin reflect a market that has rebalanced considerably from the extreme seller-favored conditions of 2021 and 2022. Inventory has accumulated as demand has softened under the weight of higher mortgage rates and affordability constraints, and the distribution of those listings tilts heavily toward the accessible end of the market. Roughly 60% of active inventory sits between $225,000 and $699,000, corresponding to the 5th through 60th percentile bands. Another 916 listings are priced above $1,199,000, showing that the upper-mid and luxury segments also carry significant active inventory. This active listing count and its distribution are key inputs for any Austin housing market update or Austin real estate trends analysis.