Austin Housing Market Deep Dive: Freddie Mac House Price Index (FMHPI®) – June 2025 Analysis
The Freddie Mac House Price Index (FMHPI®) offers a month‑by‑month examination of U.S. home price trends by tracking repeat sales of the same properties over time. This approach is more precise than relying on simple average or median sale prices because it eliminates distortions caused by varying property mix. Updated through June 2025 and released on July 31, 2025, the FMHPI® provides the clearest standardized measure available for metro‑level price movement.
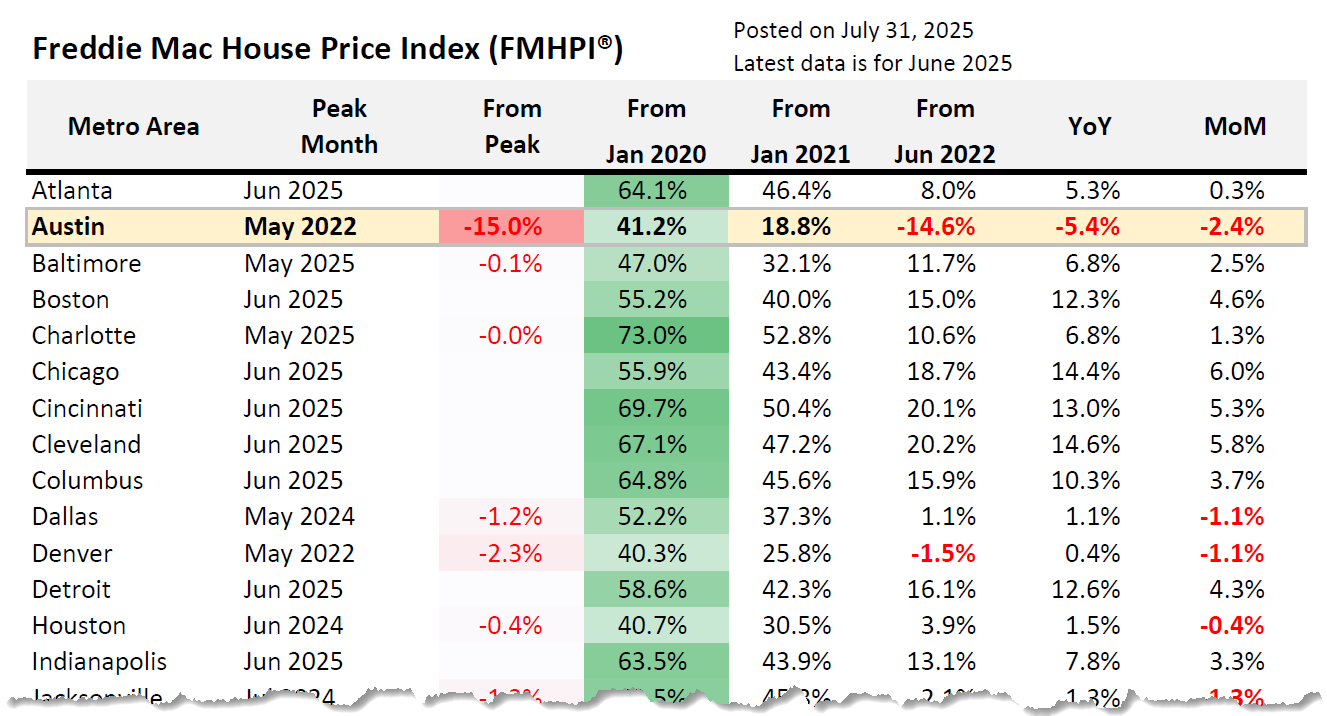
As of June 2025, the FMHPI® shows that Austin‑Round Rock‑Georgetown home prices are down 15.0 percent from their May 2022 peak. Between that peak and the latest reading, Austin has experienced the steepest correction among the 40 major U.S. metropolitan areas tracked by Freddie Mac. The year‑over‑year change for Austin registers at –2.4 percent, contrasting sharply with a national average annual gain of approximately +6.8 percent. Month‑over‑month change for Austin in June is slightly negative at –0.1 percent, while the national average increased around +1.63 percent.
These figures show that Austin remains one of the most corrected markets in the country. Even after declining 15 percent from peak, home prices in Austin still stand about 41.2 percent above January 2020 levels and roughly 18.8 percent above January 2021 benchmarks, illustrating how dramatic the pandemic era run‑up was and how much value has since been given back.
When compared nationally, many U.S. metros have posted substantial growth since 2020, with cities like Chicago, New York, Cleveland, and Milwaukee showing year‑over‑year gains in the 5‑7 percent range and cumulative growth exceeding 50 percent. By contrast, Austin has not regained its earlier highs, ranking near the bottom in both year‑over‑year performance and peak‑to‑current indexes.
Economic conditions in Austin, such as rising mortgage rates, elevated supply, and affordability constraints, have slowed demand even as inventory continues to expand. Local figures reported by the Austin Board of Realtors indicate that the median single‑family home price in the metro declined about 2.4 percent in the first half of 2025 to $439,000. Active listings rose nearly 20 percent year‑over‑year to around 76,020 units, producing roughly 5.5 months of inventory—just under the six‑month level traditionally considered balanced or slightly in favor of buyers.
The surge in resale listings is driving much of the inventory growth. Between early March and early June of 2025, resale listings increased by over 53 percent, while new construction listings grew by only about 7 percent. On June 4, 2025, resale made up nearly 77 percent of all active listings, though new construction retained a higher activity index (31.4 percent pending) compared to resale (about 18.0 percent pending), indicating stronger buyer movement per listing in the new build segment.
The FMHPI® data serves as a core benchmark for understanding long‑term pricing cycles, but it should be interpreted alongside MLS‑level supply indicators, absorption rates, and pending contract trends to get the full picture. For buyers, the data suggests negotiating power remains elevated compared to more resilient markets. Sellers must calibrate expectations using benchmarked trends rather than relying on peak pricing that may not return soon.
In short, Austin remains one of the most corrected major housing markets as of June 2025. Home values have declined sharply from their May 2022 highs, year‑over‑year trends remain negative, and inventory has surged. Yet pricing remains elevated relative to pre‑pandemic baselines. The data reveals a market in transition rather than collapse, with long‑term fundamentals still intact even as short‑term price recovery lags national growth.
FAQ
What is the Freddie Mac House Price Index (FMHPI®)?
The FMHPI® is a repeat‑sales index tracking conventional conforming mortgage transactions purchased or securitized by Freddie Mac. It measures value change by comparing prices of the same homes over time. By excluding new construction or atypical sales, it provides a highly consistent and standardized measure of home price movement across metros, states, and nationally. Updated monthly, the index captures cumulative changes since anchor points like January 2020 or May 2022, as well as recent month‑over‑month and year‑over‑year shifts.
Why is Austin showing one of the largest declines in FMHPI®?
Austin’s price drop reflects both the extreme run‑up in values from 2020 to mid‑2022 and the impact of rising rates and increased supply since. Austin home prices surged during the pandemic due to remote work migration and tech industry growth. When affordability deteriorated and inventory rose, demand cooled more sharply than in many other metros. That created a deep correction, with values now down 15.0 percent from the May 2022 peak, the steepest decline among 40 major U.S. metros tracked by the index.
How do the FMHPI® numbers compare to local MLS median price data?
FMHPI® data tends to move more gradually than median sale prices but offers greater consistency over time. Local MLS data for Austin shows the median sold price declined approximately 2.4 percent in the first half of 2025 to $439,000, with median levels at about $450,000 in June and a year‑over‑year drop of 1.6 percent. FMHPI® measured a similar trajectory: a –2.4 percent annual change and a nearly flat month‑over‑month shift in June. Combining both datasets provides a fuller view of both median transaction pace and underlying value movements.
What does rising inventory mean for homebuyers and sellers in Austin?
Inventory rose nearly 20 percent year‑over‑year, placing the metro at about 5.5 months of supply. That level tends to signal a more balanced market or moderate advantage for buyers. Most of the increase came from resale listings, which grew by over 50 percent from March to June 2025. More choices and longer days on market give buyers more leverage, while sellers may need to adjust pricing to account for increased competition. New construction continues to have a stronger flow into pending contracts relative to resale listings.
Is Austin’s housing market heading toward a crash or recovery?
Based on consensus definitions, Austin is in a significant correction phase but not a crash. Median sold price is still roughly 41 percent above January 2020 levels, and year‑over‑year declines remain modest. February through June produced negative annual and monthly performance, but inventory increases and pending sales signs indicate stabilization rather than collapse. Sustained activity, job growth, and ongoing in‑migration suggest long‑term fundamentals remain supportive despite short‑term softness.