Understanding Austin’s Housing Market Trends and FHA Loan Performance in 2025
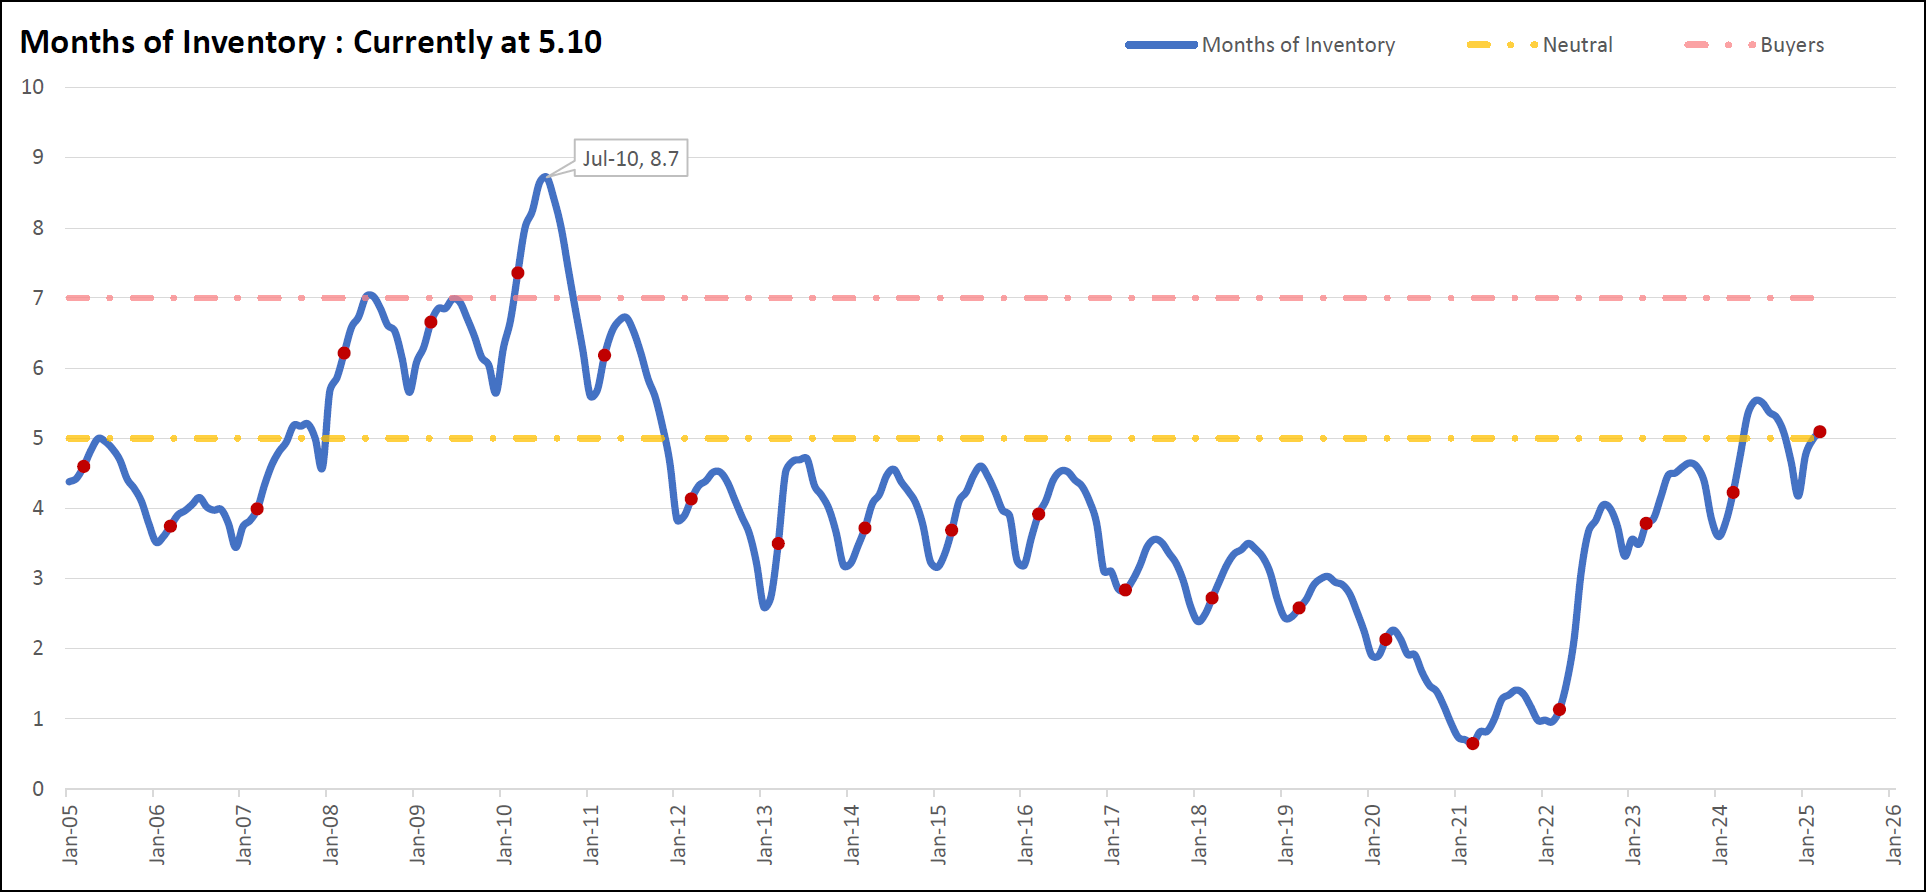
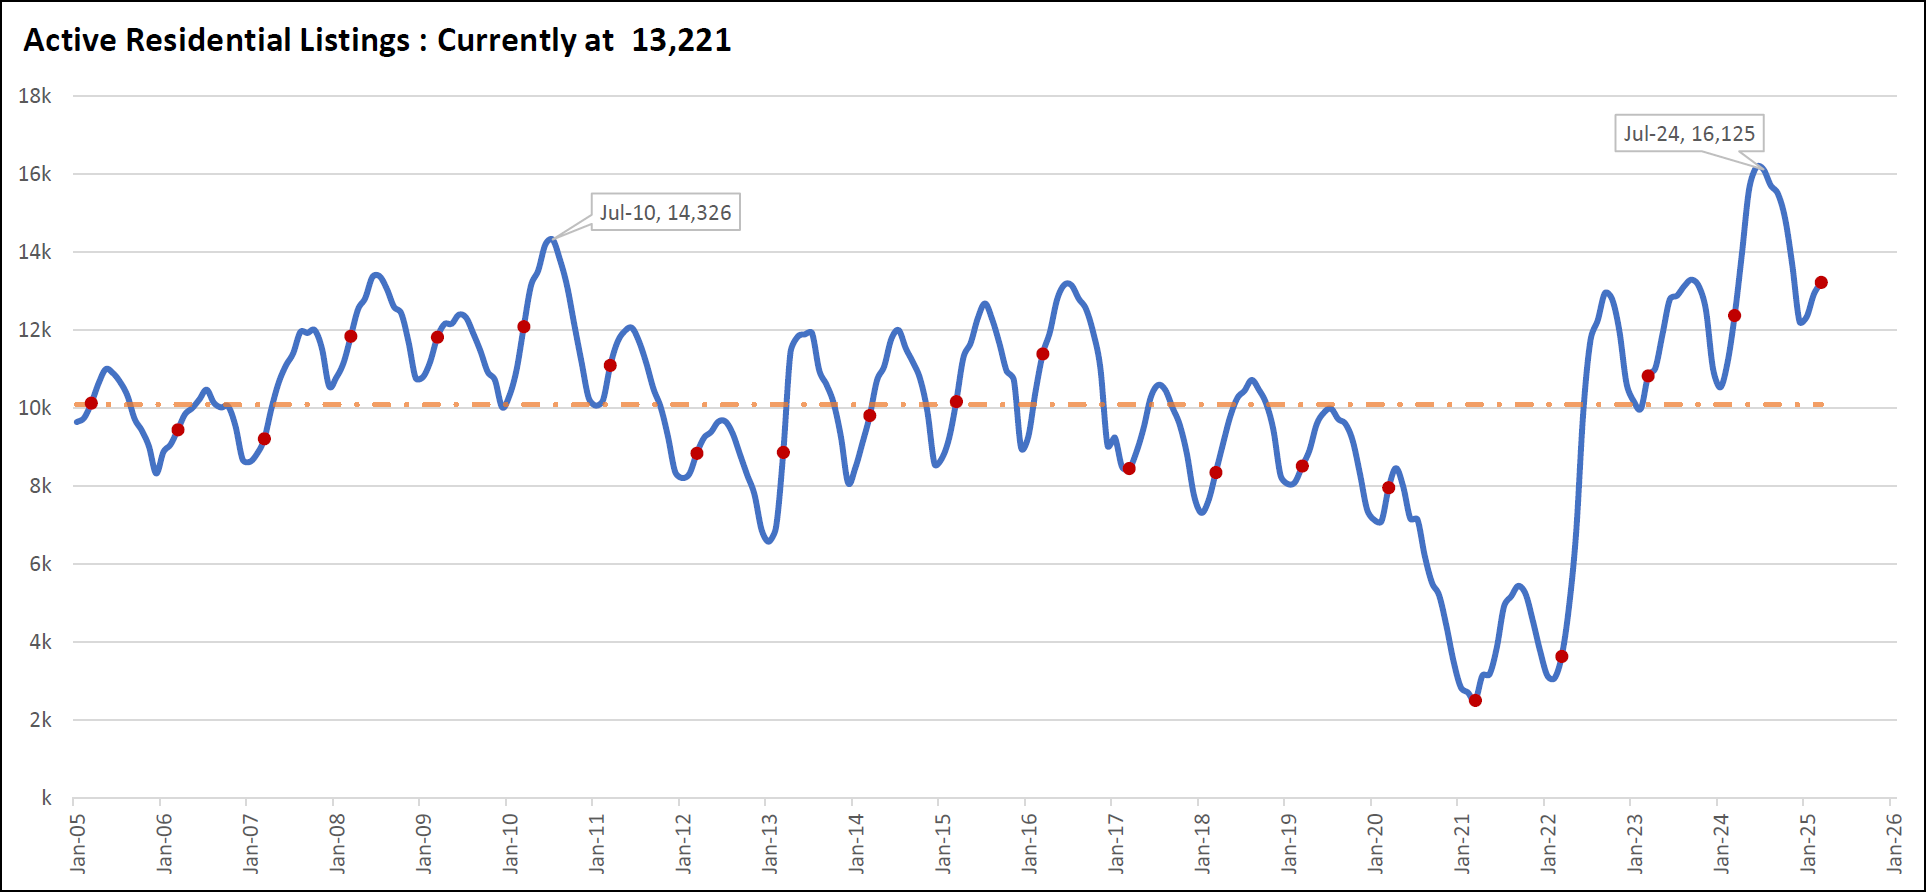
The housing market in Austin, Texas, has been a rollercoaster over the past two decades, with dramatic shifts in inventory, sales, and market conditions. As of March 8, 2025, data from Team Price Real Estate shows active residential listings at 13,221, a notable increase from 3,630 in March 2022. That’s a jump of 264.2% in just three years. Meanwhile, home sales have taken a dip, with a projected 2,514 homes sold in March 2025, down 19.9% from 3,139 the previous year and a steep 46.0% drop from the peak of 4,660 in June 2021. This shift has pushed the Months of Inventory (MOI)—a measure of how long it would take to sell all homes at the current pace—to 5.1 months, landing the market in neutral territory between a seller’s and buyer’s market.
But what’s driving these changes, and why aren’t we seeing a wave of distressed properties like foreclosures despite the cooling demand? To answer that, we need to look at both local trends and national data, including the latest FHA Single Family Loan Performance Trends report from November 2024.
Let’s start with Austin’s history. Back in 2006, before the housing bubble burst, active listings sat at 9,445 in March, climbing to a peak of 14,326 by July 2010 as the Great Recession hit. That’s a 51.7% increase over four years, driven largely by foreclosures and distressed sales after sales plummeted 55.0% from 3,341 in June 2006 to 1,503 in March 2009. The MOI soared to 8.7 months in July 2010, signaling a buyer’s market where homes lingered unsold. Fast forward to today, and the numbers tell a different story. Inventory has spiked much faster—up 198.3% year-over-year from March 2022 to March 2023 alone—yet sales declines, while significant, haven’t hit the depths of 2009. So, why isn’t this looking like the last housing correction?
One big clue comes from the FHA Single Family Loan Performance Trends report, published by the U.S. Department of Housing and Urban Development in December 2024. This report tracks loans insured by the Federal Housing Administration, which are popular among first-time buyers—a key group in Austin’s market. As of November 2024, 7,851,909 FHA loans were active, with a serious delinquency rate (loans 90+ days late, in foreclosure, or bankruptcy) of 4.41%, up from 3.91% a year earlier. That’s a sign of growing financial strain. Breaking it down, 3.60% of loans were 90+ days delinquent, 0.37% were in foreclosure, and 0.44% were in bankruptcy. Despite this, foreclosure starts have stayed steady, dropping slightly from 6,073 in November 2023 to 5,563 in November 2024, with an annualized foreclosure rate of just 0.16%. Loans in foreclosure also fell from 44,042 in March 2023 to 29,402 in November 2024. This stability stands out when compared to the 2008–2010 period, where foreclosures surged and fueled inventory.
So, what’s keeping distressed properties at bay? The FHA data offers insight. Programs introduced in recent years help borrowers avoid foreclosure by allowing missed payments to be added to the loan’s principal without interest. For example, a borrower missing five $4,000 payments would see $20,000 tacked onto their loan, and their monthly payment could be cut by $1,000 for three years, adding another $36,000 to the principal—totaling $56,000 in extra debt, interest-free. The FHA paid out 556,841 such “incentive payments” to mortgage servicers in the past year, nearly matching the number of new loans insured. This approach, detailed in a February 23, 2025, Wall Street Journal article by Allysia Finley titled “Biden’s Mortgage ‘Relief’ Fuels Higher Housing Prices,” keeps homes off the foreclosure market, even as 7.05% of FHA loans from 2023 went seriously delinquent within 12 months—higher than the 7.02% peak in 2008.
Looking closer at FHA borrowers, the risk profile has grown. In 2007, 35% of new FHA borrowers had debt-to-income (DTI) ratios above 43%; by 2020, that rose to 54%, and last year, it hit 64%. About 79% of first-time FHA buyers in 2024 had less than a month’s worth of financial reserves, according to estimates from the American Enterprise Institute’s Ed Pinto and Tobias Peter, cited in the Wall Street Journal piece. Table 3 from the FHA report backs this up: loans to borrowers with credit scores below 620 have serious delinquency rates as high as 8.41%, compared to 1.32% for those above 720. Loans from the 2019 cohort show a 7.50% serious delinquency rate, while newer 2024 loans are at 1.72%. Despite this risk, foreclosure remains rare, thanks to these relief programs.
In Austin, this national trend likely plays a role. The city’s inventory jumped to 16,179 in June 2024 before easing to 13,221 by March 2025—a 18.3% drop from the peak but still far above the 3,630 low in March 2022. Sales, meanwhile, have cooled from 3,636 in March 2022 to 2,514 projected for March 2025. Yet, unlike 2008–2010, when foreclosures drove inventory up and MOI hit buyer’s market levels, today’s MOI of 5.1 suggests balance, not distress. The FHA report’s Table 5 shows Texas REO recovery rates at 61.3% in October 2024, down from 74.7% a year earlier, but with only 41 dispositions, it’s a small piece of the puzzle. Table 6 reveals net loss rates on foreclosed properties at 30.18% in November 2024, with an average loss of $39,290 per property—manageable figures that don’t signal a flood of distressed sales.
Comparing the two periods highlights the contrast. From 2006 to 2010, inventory grew gradually as sales crashed, with foreclosures pushing MOI to 8.7. Today, inventory soared quickly—264.2% from March 2022 to March 2025—while sales dropped 46.0% from their peak. But the FHA’s foreclosure rate of 0.37% and declining in-foreclosure loans (29,402 in Nov 2024) show no parallel to the 2008–2010 distress wave. The Wall Street Journal notes that servicers are incentivized to keep borrowers in homes, earning $1,750 per intervention, which could explain why Austin’s inventory rise stems from market cooling—like higher interest rates—rather than foreclosures.
The FHA data also sheds light on who’s struggling. Purchase loans (72.24% of FHA’s portfolio) have a 4.99% serious delinquency rate, while first-time buyers (85.22% of purchase loans) face 5.16%, compared to 3.96% for repeat buyers. Loans with down payment assistance from relatives or sellers show rates up to 8.11%. Yet, foreclosure starts hover around 6,000 monthly, and claims paid by HUD for completed foreclosures are steady at 1,039 in November 2024. This suggests that while borrowers are stretched, relief measures are holding the line—keeping Austin’s market from tipping into a 2008-style crisis.
So, what does this mean for Austin in 2025? The data paints a picture of a market adjusting after a boom, with inventory up and sales down, but not collapsing under distress. The FHA’s 4.41% serious delinquency rate and stable foreclosure stats signal pressure, but not a breaking point. Unlike 2006–2010, when foreclosures defined the correction, today’s policies are cushioning the fall. For now, Austin’s housing market—and the broader FHA portfolio—seems to be navigating a slowdown, not a crash, thanks to a safety net that wasn’t there last time.
FAQ Section
What is the housing market like in Austin in 2025?
As of March 2025, Austin’s housing market has 13,221 active listings, up 264.2% from 3,630 in March 2022, according to Team Price Real Estate. Sales are projected at 2,514 for March, down 19.9% from 3,139 in 2024, with an MOI of 5.1 months, indicating a balanced market between buyers and sellers.
How do FHA loans affect the housing market?
FHA loans, tracked in the November 2024 FHA Single Family Loan Performance Trends report, support first-time buyers (85.22% of purchase loans) but show a 4.41% serious delinquency rate. Relief programs adding missed payments to principal without interest (e.g., $56,000 per case) prevent foreclosures, stabilizing markets like Austin’s by keeping distressed homes off the market.
Why aren’t there more foreclosures in 2025?
The FHA report shows foreclosure starts steady at 5,563 in November 2024, with a 0.16% annualized rate. Programs paying servicers (556,841 payments last year) to defer payments to loan principal, as noted in the Wall Street Journal (Feb 23, 2025), reduce foreclosures despite a 7.05% delinquency rate for 2023 FHA loans.
How does the 2025 housing market compare to 2008?
Austin’s inventory rose 264.2% from 2022 to 2025, far outpacing the 51.7% increase from 2006 to 2010. Sales dropped 46.0% from 2021 to 2025, less than the 55.0% fall from 2006 to 2009. Unlike 2008–2010, when foreclosures drove MOI to 8.7, FHA policies keep today’s distress low, with MOI at 5.1.
What are Months of Inventory, and why do they matter?
Months of Inventory (MOI) measures how long it takes to sell all active listings at the current sales pace. Austin’s MOI is 5.1 in March 2025, per Team Price data, meaning it’s neutral (5–7 months). Below 5 favors sellers; above 7 favors buyers. It’s a key indicator of market health and balance.
Credits : Data in this article is sourced from Team Price Real Estate (last revised March 8, 2025), the FHA Single Family Loan Performance Trends report (November 2024, published December 2024 by HUD), and “Biden’s Mortgage ‘Relief’ Fuels Higher Housing Prices” by Allysia Finley, Wall Street Journal, February 23, 2025. The FHA report is embedded below for reference.