Austin Housing Market Split: Top-Tier Homes Outperform Bottom 25% | July 2025 Trends
Published | Posted by Dan Price
“As price corrections continue across Austin’s housing market, a widening divide has emerged—where top-tier homes are outperforming the bottom quarter in a clear split of pricing resilience.”
In the latest July 2025 data snapshot, a growing disparity has emerged between Austin's highest and lowest-priced homes. The top 25th percentile of sales is holding value—and in many cases gaining ground—while the bottom 25th percentile is slipping further into discount territory. This divergence is not just anecdotal; it is backed by consistent year-over-year trends across nearly all submarkets, as reflected in the Austin Daily Real Estate Briefing.
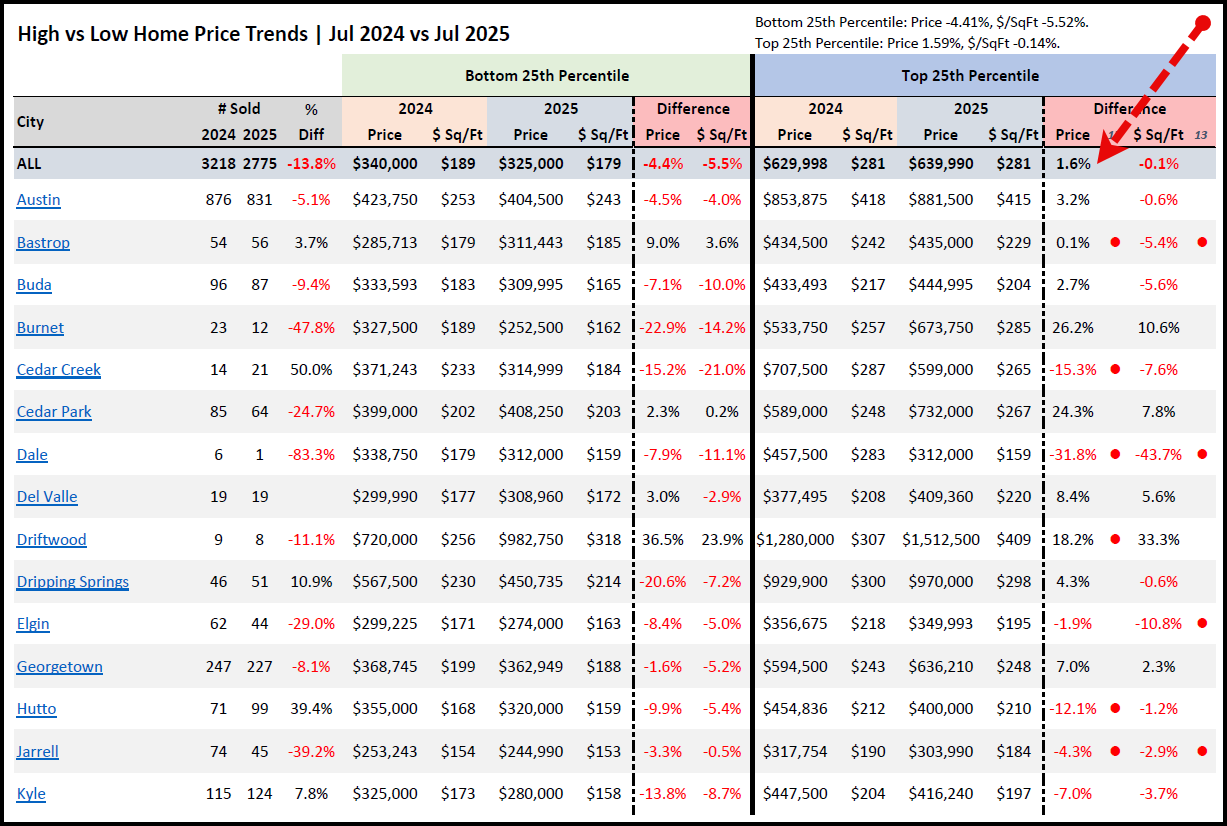
Citywide, homes in the bottom 25th percentile experienced a -4.41% year-over-year decline in median price and a -5.52% decline in price per square foot. Conversely, the top 25th percentile saw a modest but telling increase of 1.59% in price, with price per square foot essentially flat at -0.14%. This contrast illustrates a market where wealthier buyers are still transacting—perhaps less impacted by interest rate sensitivity—while more affordable homes are subject to deeper pricing pressure due to over-supply, cautious financing, and affordability ceilings.
This top-versus-bottom trend is observable across a diverse range of Austin-area cities. In Driftwood, for example, the upper quartile surged by 36.5% in price and 23.9% in price per square foot—an exceptional performance even in a luxury rural market. Burnet showed a 26.2% increase in high-end sale prices, and Cedar Park’s top-tier properties climbed 24.3%, even as the broader market contracted. Meanwhile, in the same cities, lower-priced homes dropped sharply. Burnet’s bottom 25th percentile declined -22.9% in price and -14.2% per square foot, while Cedar Park’s lower tier fell -2.3% in price and -0.2% per square foot.
Perhaps most notable is the stark divide in pricing velocity and magnitude. In Dale, the lowest quartile saw a -7.9% price decline and a sharp -11.1% drop in price per square foot. At the high end, the same area recorded a dramatic -31.8% price cut and an astonishing -43.7% drop per square foot. However, this appears more an outlier due to volume volatility—only six sales occurred in 2024 and one in 2025—highlighting the need for context in smaller submarkets.
The overall takeaway is that homes in the top 25th percentile are either holding steady or growing modestly in value, while the most affordable homes continue to shed pricing power. In areas like Del Valle and Dripping Springs, luxury homebuyers demonstrated more confidence and stronger buying power, fueling 8.4% and 4.3% price growth at the top end, respectively. In contrast, the entry-level markets saw compressions of -2.9% in Del Valle and -7.2% in Dripping Springs on a price per square foot basis, reflecting more negotiating pressure and demand softness.
There are several drivers behind this divergence. First, higher-income buyers are less affected by interest rate hikes and are more likely to be cash or jumbo-loan buyers who aren’t subject to traditional lending constraints. This allows them to stay active even as borrowing costs rise. Second, inventory in the luxury space is tighter in certain cities and often includes homes with premium features, land, or location-based desirability that holds value even in downturns. Third, many entry-level buyers have been pushed out of the market due to affordability issues, which has dragged down competition and leverage in the lower end of the market.
The data from Austin itself illustrates this tension well. The bottom quartile fell -4.5% in price and -4.0% in price per square foot, while the top 25th percentile rose 3.2% in price, with only a marginal -0.6% decrease in per-square-foot pricing. This type of split points to a K-shaped market recovery where higher-end homes rebound or stabilize faster while lower-priced inventory continues to see softening.
In Buda, the dynamic is particularly revealing. The bottom 25th percentile homes dropped -7.1% in price and -10.0% in price per square foot, while the top-tier segment increased by 2.7% in price, though down -5.6% per square foot. This points to weaker entry-level demand, likely driven by financing strain and increased days on market, while higher-end buyers are still engaging, albeit with slightly more conservative offers.
Georgetown, despite a large sample size, echoed similar themes. Bottom-tier homes dipped -1.6% in price and -5.2% in price per square foot. Meanwhile, the top 25th percentile grew 7.0% in price with a modest 2.3% gain per square foot—showing this trend is not isolated to rural or luxury-only markets.
Cedar Creek and Elgin revealed some of the most dramatic disparities. Cedar Creek’s bottom tier dropped -15.2% in price and -21.0% in price per square foot. At the top, it saw -15.3% and -7.6% reductions respectively, showing weakness across both spectrums in some rural or transitional submarkets. In Elgin, while the bottom 25th percentile declined -8.4% and -5.0%, the top-end held relatively flat in price (-1.9%) but saw a -10.8% drop in price per square foot, indicating more buyer pushback even at the higher end.
Jarrell, another traditionally affordable area, followed suit with bottom-tier pricing dropping -3.3% and per-square-foot down -0.5%, while the top end fell more substantially—down -4.3% in price and -2.9% per square foot—showing more across-the-board price sensitivity in cities with weaker demand anchors or elevated new construction exposure.
This widening gap between high-end and low-end pricing performance speaks to more than just income disparity—it signals a bifurcated market structure. Buyers with capital or favorable loan positions are still transacting, especially when they can find quality or scarcity-driven inventory. Meanwhile, entry-level buyers—those more exposed to mortgage rate pressure, job insecurity, or tighter debt-to-income constraints—are pulling back or being priced out, resulting in higher days on market and more markdowns.
For sellers, especially in the lower 25th percentile, this market dynamic underscores the importance of pricing strategy, condition, and presentation. Overpricing a starter home in this climate is a fast track to sitting stale on the MLS. For those in the top tier, there’s more margin for error, but only slightly—many cities still saw flat or negative per-square-foot returns at the high end.
In conclusion, July 2025 continues to reinforce the bifurcation of the Austin housing market. The top 25th percentile is weathering the correction with resilience and, in some submarkets, outright gains. The bottom 25th percentile, however, remains under pressure and will likely require further adjustments as buyers hold out or retreat. As the second half of the year unfolds, this segmentation will be key to understanding where recovery might first emerge—and where sellers and investors will face continued headwinds.