Austin Real Estate Market Splits Wide Open: Both Price Tiers Now Negative in March 2026
Team Price Real Estate | March 9, 2026
For most of the past two years, the Austin real estate market could be described as a tale of two tiers. The bottom 25% of the market — entry-level and affordable homes — had been absorbing price declines while the top 25% held relatively firm, occasionally even showing year-over-year gains. That bifurcation gave the luxury and upper-mid segments a kind of insulation that the lower end of the market simply did not have. As of March 2026, that insulation is gone. For the first time in this correction cycle, both price tiers are now negative across the entire Austin metro — and the data behind that shift tells a more nuanced and sobering story than a single headline number can convey.
The Headline Shift: A Market That Can No Longer Hide Behind Its Upper Tier
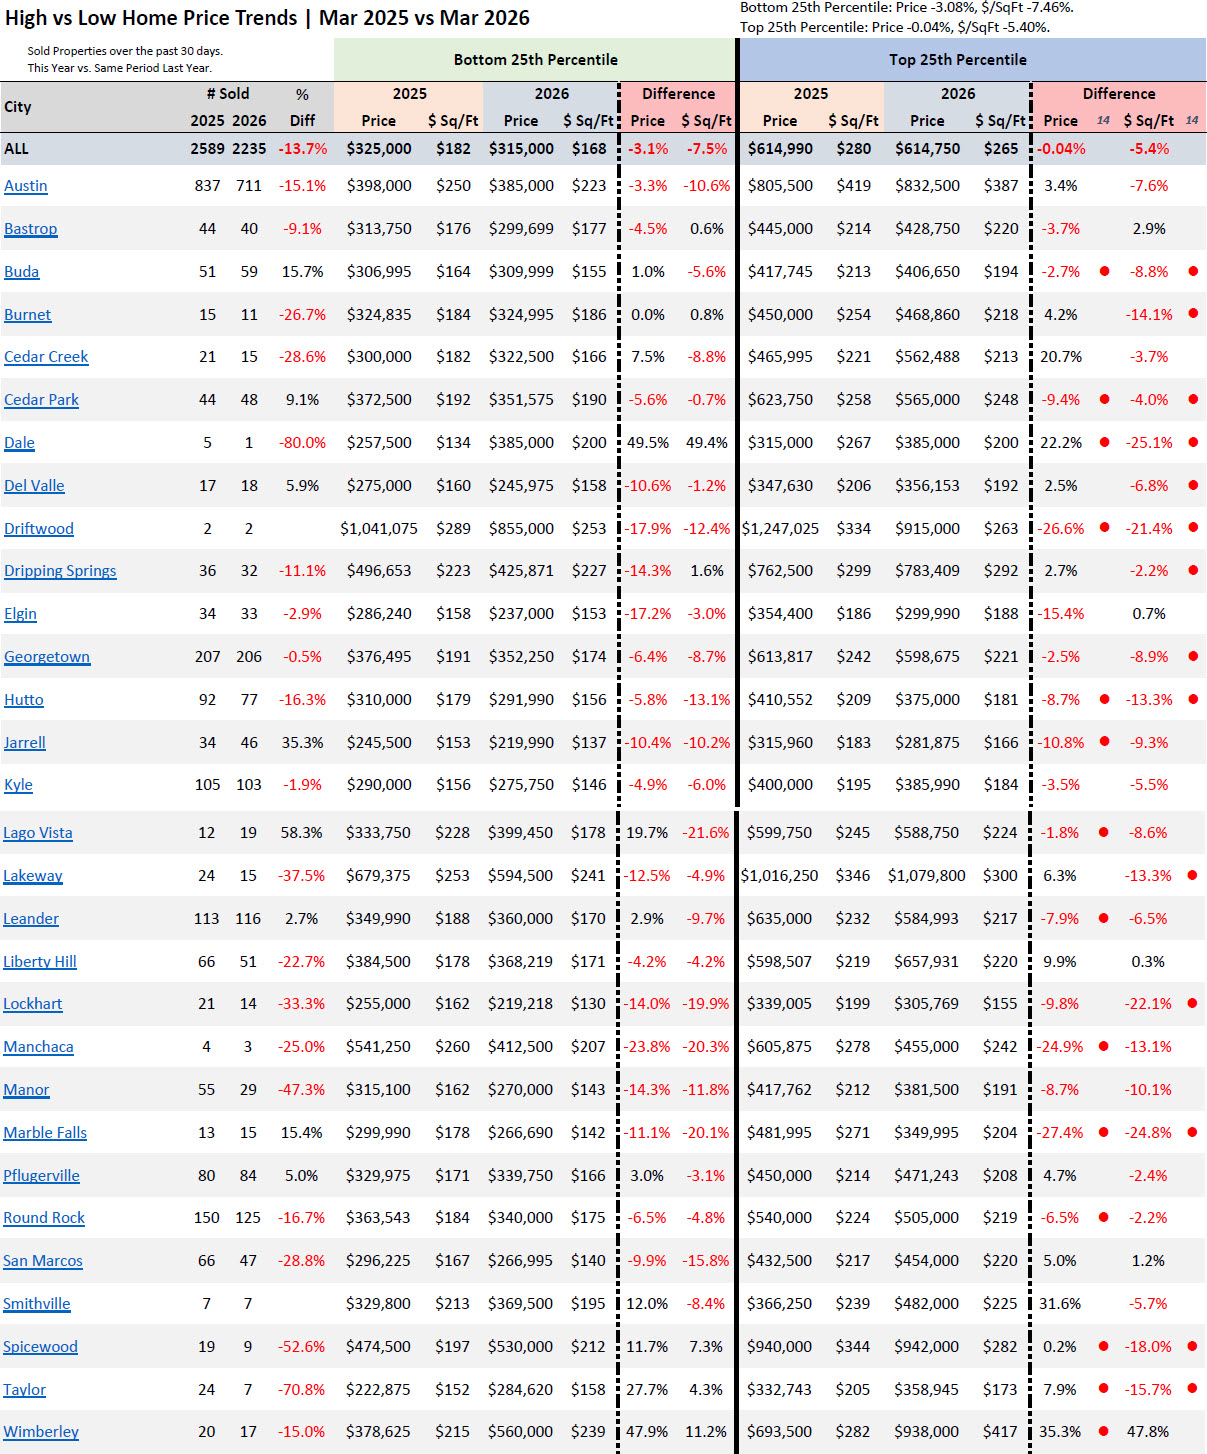
Looking at the overall Austin housing market data for properties sold over the past 30 days compared to the same period last year, the numbers are unambiguous. The bottom 25th percentile is down 3.1% in price and down 7.5% in price per square foot year over year. The top 25th percentile, which had been the market's most reliable anchor, is now down 0.04% in price and down 5.4% in price per square foot. The nominal price decline at the top is nearly imperceptible — essentially flat — but the price-per-square-foot figure of -5.4% reveals something more significant: buyers are paying meaningfully less per square foot for upper-tier homes than they were a year ago, even when the headline price looks stable.
This matters because price per square foot strips away the effect of shifting home sizes in the sales mix. When a market shows a flat median price but a declining price per square foot, it typically means that larger — and therefore nominally more expensive — homes are making up a greater share of sales, masking underlying price weakness. That is precisely what appears to be happening at the top of the Austin property market right now. The top tier has not escaped the correction; it has simply been obscuring it.
City-by-City Breakdown: Where Both Tiers Are Falling — and Where They Diverge
The table below shows year-over-year price change and sales volume for selected cities across the Austin metro. Cities marked with a red dot (●) are those where the top 25th percentile is underperforming the bottom 25th percentile — meaning the expensive tier in that city is falling harder than the affordable tier. Note: cities with fewer than 10 sales (Driftwood, Dale, Manchaca, Smithville) should be interpreted with caution due to small sample sizes.
The Red Dot Cities: Where Expensive Homes Are Falling Faster Than Affordable Ones
One of the most important signals in this dataset is the red dot designation — cities where the top 25th percentile is declining more sharply than the bottom 25th percentile. This is a reversal of the pattern that defined the Austin housing market throughout much of 2024 and early 2025, when upper-tier homes held value better than entry-level properties. Several cities now showing this reversal are among the metro's most significant markets by volume.
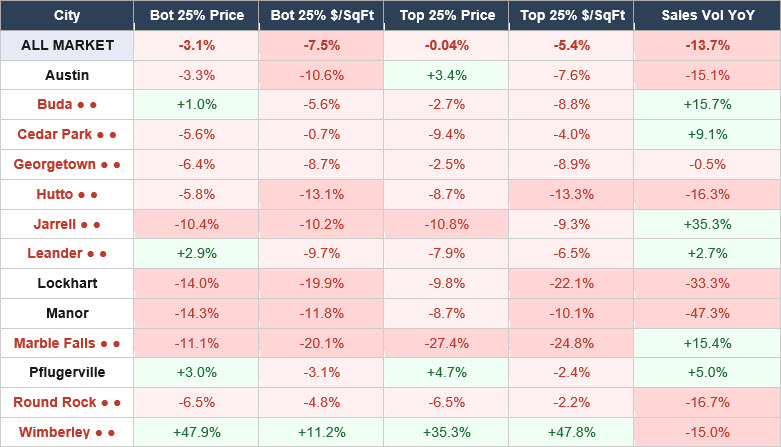
Cedar Park is a clear example of this dynamic. The bottom 25th percentile there is down 5.6% in price year over year, but the top 25th percentile has fallen 9.4% — nearly double the rate of the lower tier. Hutto tells a similar story: the bottom tier is off 5.8% while the top tier has dropped 8.7%, with price-per-square-foot declines of 13.1% and 13.3% respectively, meaning both segments are experiencing significant value erosion on a square-footage basis. Round Rock, one of the metro's highest-volume markets, shows the top and bottom tiers declining at an identical 6.5% rate in price, with sales volume down 16.7% year over year — a sign of broad market softness rather than tier-specific weakness.
Leander presents a particularly interesting case. The bottom 25th percentile there is actually up 2.9% in price year over year, suggesting some resilience at the entry level — but the top 25th percentile has declined 7.9%. That kind of inversion, where affordable homes are holding value better than expensive ones, is a meaningful signal about where buyer demand is concentrated in that market right now. When buyers have limited purchasing power due to elevated mortgage rates, the affordable tier often holds up better simply because more buyers can qualify for those price points.
The Hardest-Hit Markets: Manor, Marble Falls, and Lockhart
Beyond the red dot dynamic, several Austin-area markets are experiencing steep declines across both tiers simultaneously. Manor stands out as one of the most pressured markets in the dataset. The bottom 25th percentile is down 14.3% in price and 11.8% in price per square foot, while the top 25th percentile has declined 8.7% in price and 10.1% in price per square foot. Compounding those figures is a dramatic 47.3% drop in sales volume year over year — from 55 sales in the prior period to just 29 — which suggests that buyer interest in Manor has pulled back sharply. When volume falls that steeply alongside price declines, it typically reflects a market where buyers and sellers are struggling to find common ground on price.
Marble Falls is showing some of the steepest price-per-square-foot declines in the entire dataset. The bottom 25th percentile is off 20.1% in price per square foot, while the top 25th percentile has fallen 24.8% — a red dot city where the upper tier is once again deteriorating faster than the lower. The top-tier price decline of 27.4% in Marble Falls is among the most severe of any market in this report. Lockhart similarly shows broad weakness: the bottom 25th percentile is down 14.0% in price and 19.9% in price per square foot, while the top 25th percentile has fallen 9.8% in price and 22.1% in price per square foot. Sales volume in Lockhart is also down 33.3%, reinforcing the picture of a market losing both buyers and pricing power simultaneously.
Bright Spots in the Data: Austin City Proper, Pflugerville, and Wimberley
Not every market in the Austin metro is declining across both tiers. The city of Austin proper stands as one of the few markets where the top 25th percentile is showing positive year-over-year price growth at 3.4%, even as the bottom 25th percentile has dipped 3.3%. This divergence is consistent with Austin's urban core continuing to attract high-end buyers who value proximity, walkability, and access to employment centers — a demand profile that tends to be less sensitive to mortgage rate headwinds than the broader suburban market. That said, Austin's top-tier price per square foot is down 7.6% year over year, again indicating that the headline price stability may be partially a function of larger homes transacting rather than true price appreciation.
Pflugerville is one of the cleaner positive stories in the dataset, with the bottom 25th percentile up 3.0% in price and the top 25th percentile up 4.7%, against a relatively modest price-per-square-foot decline. Sales volume is up 5.0% year over year, making Pflugerville one of a small number of markets showing simultaneous gains in both price and transaction count. Wimberley shows dramatic positive year-over-year numbers — bottom tier up 47.9%, top tier up 35.3% — but with only 17 sales in the current period versus 20 a year ago, the sample size is too small to draw broad conclusions. Small volume shifts can produce extreme percentage swings that do not reflect genuine market-wide trends.
Volume Decline: The Hidden Story in the Transaction Count
Across the entire Austin metro, total sales volume for the past 30 days has dropped 13.7% year over year, from 2,589 transactions in the same period last year to 2,235 today. This is not a minor fluctuation — it represents more than 350 fewer transactions in a single month compared to the prior year. Declining volume matters because it affects the reliability of price data, reduces commission-based economic activity, and often precedes further price adjustments as sellers who need to transact are forced to negotiate with a smaller pool of active buyers.
The volume declines are not evenly distributed. Some of the sharpest drops are concentrated in markets that are also experiencing the steepest price declines — Manor at -47.3%, Taylor at -70.8%, and Spicewood at -52.6% — though the latter two have very small absolute transaction counts that make percentage comparisons less meaningful. Among larger markets, Round Rock (-16.7%), Austin city (-15.1%), and Hutto (-16.3%) all show meaningful volume contractions that carry statistical weight given their higher transaction counts. These are markets to watch closely over the coming months as the spring selling season develops.
What This Means for the Austin Real Estate Market Heading Into Spring 2026
The convergence of both price tiers into negative territory is a meaningful development in the austin real estate trends picture. It suggests that the forces driving the correction — elevated mortgage rates, high insurance and property tax costs, and a substantial inventory overhang — are broad enough to affect the entire market rather than just its most affordable segment. The fact that the top tier is now declining on a price-per-square-foot basis even as nominal prices remain nearly flat is particularly important for sellers and investors who have been measuring their positions using headline price data. The actual purchasing power being applied to upper-tier Austin homes has declined.
For buyers, this data reinforces that the Austin housing market update for March 2026 is one of continued opportunity — particularly in suburban markets where both price tiers are softening and volume is contracting. Negotiating leverage remains elevated in most of the metro's suburban communities. For sellers, especially those with upper-tier properties in red dot cities, the data argues for honest pricing conversations. Waiting for the market to recover while carrying a property priced at 2024 levels is increasingly difficult to justify when the transaction data shows the top tier underperforming the bottom. Accurate, data-driven pricing is the most effective tool available in the current Austin housing environment.
Frequently Asked Questions
What does it mean that both price tiers in Austin are now negative?
Throughout most of the Austin real estate correction cycle that began in 2022, the top 25th percentile of the market — upper-tier and luxury homes — had been holding value better than the bottom 25th percentile. This created a bifurcated market where entry-level buyers were feeling the brunt of price declines while higher-end sellers could point to relatively stable or even positive year-over-year comparisons. As of March 2026, that distinction has collapsed. The bottom 25th percentile is now down 3.1% in price and 7.5% in price per square foot, while the top 25th percentile has crossed into negative territory at -0.04% in price and -5.4% in price per square foot. Both tiers are now participating in the correction, which represents a broadening of market weakness across the entire austin housing market.
Why is price per square foot declining even when the median home price looks stable?
Price per square foot is often a more accurate measure of market value than median or average price because it normalizes for home size. When the median price appears flat or only slightly negative but price per square foot is declining more sharply — as is the case with Austin's top 25th percentile, where price is -0.04% but $/SqFt is -5.4% — it typically means that larger homes are making up a higher proportion of recent sales. A larger home transacting at a lower price per square foot can produce a stable or higher median price even as the true per-unit value of the underlying real estate is declining. Buyers and sellers in the austin real estate market should always examine both metrics when evaluating pricing trends.
Which Austin suburbs are seeing the steepest home price declines right now?
Based on the March 2026 data covering the past 30 days versus the same period last year, the markets showing the steepest declines across both price tiers include Manor, Marble Falls, Lockhart, Hutto, and Elgin. Manor has seen the bottom 25th percentile fall 14.3% in price alongside a 47.3% drop in sales volume, suggesting broad buyer withdrawal. Marble Falls is showing top-tier price declines of 27.4% — the largest in the dataset among markets with statistically meaningful transaction counts. Lockhart's bottom tier has declined 14.0% in price and 19.9% in price per square foot. These markets share common characteristics: suburban or exurban locations, elevated price appreciation during the 2020-2022 boom, and now significant correction pressure as affordability constraints limit the buyer pool.
What are red dot cities in the Austin housing market data and why do they matter?
In this dataset, a red dot designation indicates that a city's top 25th percentile is underperforming its bottom 25th percentile — meaning upper-tier homes are declining more sharply than entry-level homes in the same market. This is a reversal of the pattern that defined the Austin real estate market for much of 2024 and early 2025. Red dot cities currently include Cedar Park, Hutto, Buda, Round Rock, Georgetown, Leander, and Marble Falls, among others. This matters because it signals that the correction is no longer concentrated at the affordable end of the market. Sellers of higher-priced homes in these communities are now experiencing more pricing pressure than their entry-level counterparts, which has significant implications for how sellers and real estate professionals should approach pricing strategy in those specific markets.
Is Austin's overall home sales volume declining and what does that signal?
Yes, total sales volume across the Austin metro is down 13.7% year over year for the past 30 days, falling from 2,589 transactions to 2,235. This decline in transaction activity is significant for several reasons. Lower volume reduces the statistical reliability of price data, since fewer sales mean any individual transaction has a larger impact on reported averages and medians. It also reflects the broader affordability and rate challenges that are keeping potential buyers on the sidelines: when monthly mortgage payments remain elevated and buyers are uncertain about future price direction, transaction velocity slows. The volume decline is not uniform — some markets like Pflugerville (+5.0%) and Buda (+15.7%) are actually seeing increased activity — but the metro-wide contraction confirms that the overall austin housing market update for March 2026 reflects a market still working through its correction.