Austin Housing Market Shows First Recovery Signal in Two Years: April 2026 Update
The Austin housing market is sending its first real recovery signal since the 2022 correction began. In April 2026, the Market Turnover Efficiency Score (MTES) climbed to 15.0 percent, crossing back above the 14 percent threshold that separates dysfunctional market conditions from functional ones. This is the first reading above 14 percent since April 2024, and it arrives with three other leading indicators moving in the same direction at the same time: pending home sales up year over year, new listings contracting year over year, and City of Austin months of inventory down sharply. For readers tracking Austin housing market predictions and Austin real estate market trends, this is the cleanest early-recovery data the market has produced in 24 months.
Before anyone calls a bottom, a critical framing point: crossing 14 percent is the recovery threshold, not the return to normal. Based on two decades of Austin real estate data, genuinely normal market conditions correspond to MTES readings in the 17 to 20 percent range, with the long-run historical average sitting at 18.94 percent. April 2026's 15.0 percent print puts the Austin housing market at the low end of the functional band, not the middle of normal. That distinction matters for anyone trying to forecast Austin home prices, plan a listing strategy, or decide whether now is the right time to buy.
What the Data Says About "Normal" in the Austin Real Estate Market
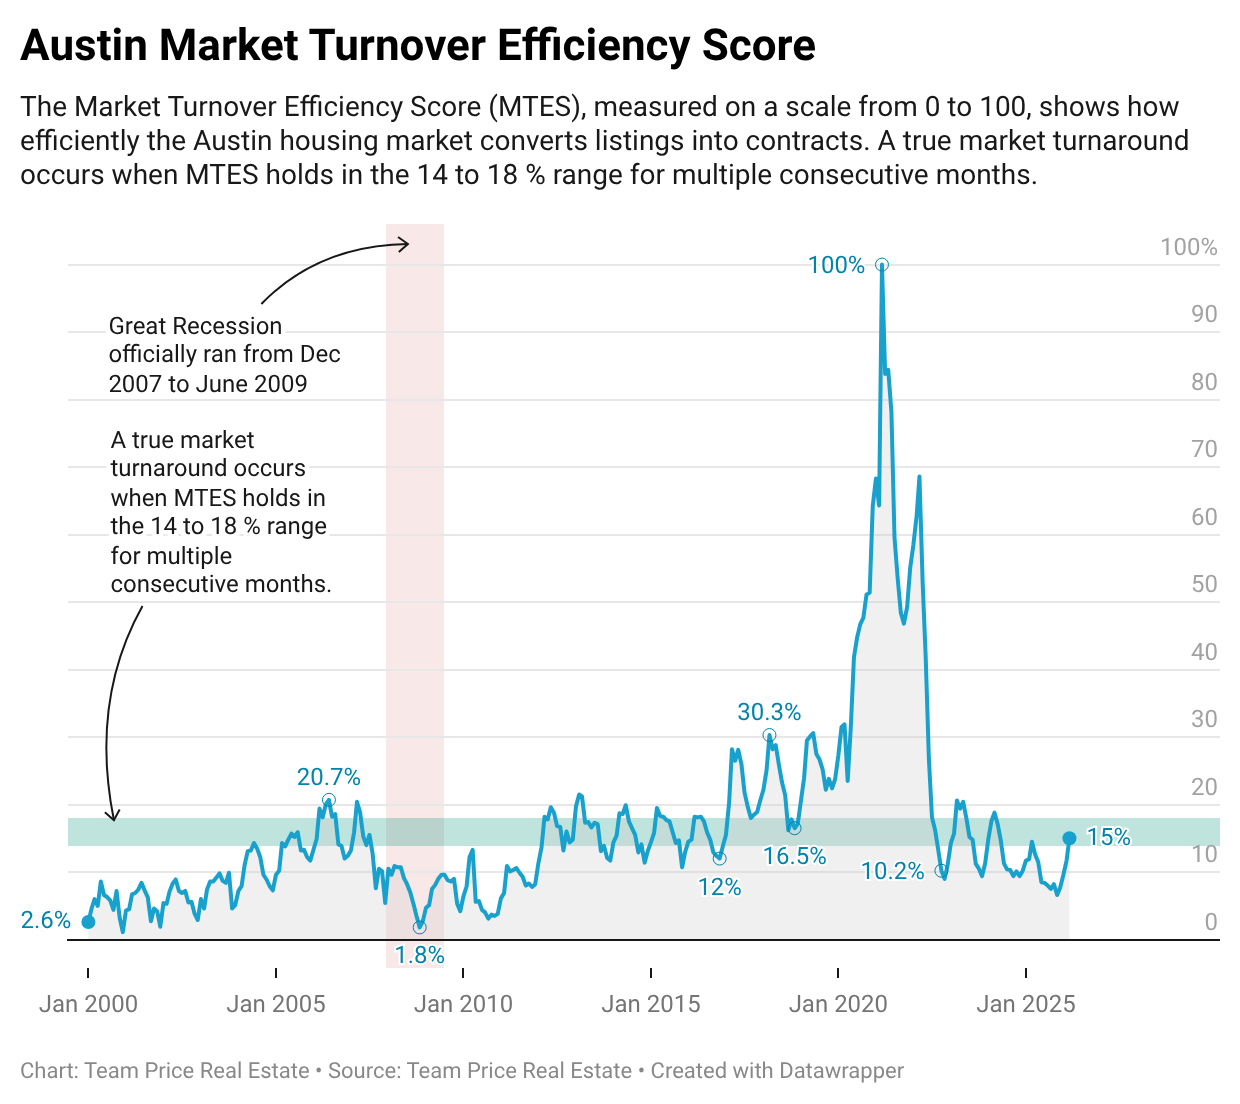
The Market Turnover Efficiency Score blends sales, new listings, and buyer contract activity into a single 0 to 100 reading that captures how efficiently the Austin real estate market converts listings into contracts. The historical average is 18.94 percent. During the pre-pandemic stable era from 2012 through 2019, annual median MTES readings ranged from 14.8 percent to 24.5 percent, with an era average of 18.4 percent. Every single year in that eight-year window sat at 14.8 percent or higher. That is what functional Austin housing market activity looks like when measured across a full cycle.
The 14 to 18 percent band represents the functional floor. A reading inside that band means the market is operating. A reading in the 17 to 20 percent range, closer to the long-run historical average, is where Austin real estate market conditions can reasonably be called normal. Readings above 20 percent signal a seller's market, and the pandemic peak of 100 percent in March 2021 is the extreme outlier in the dataset. Everything from mid-2022 through early 2026, with MTES readings running in the 8 to 13 percent range for most of that stretch, represented sub-functional market conditions where supply was outpacing absorption at a rate inconsistent with a healthy market.
April 2026 Is the First Crossing of the Recovery Threshold
The April 2026 MTES reading of 15.0 percent is the first time the Austin housing market has crossed back above 14 percent since April 2024. The jump from March to April, from 11.7 percent to 15.0 percent, is sharp. The first quarter of 2026 averaged roughly 11.1 percent across January, February, and March. April's reading is 390 basis points higher than the quarterly average. That kind of step-change typically only appears when rising demand meets contracting supply simultaneously, which is exactly what the underlying Austin real estate market data confirms.
A true market turnaround, by the methodology, requires MTES to hold in the 14 to 18 percent range for multiple consecutive months. One month is a signal. Three to six months inside the band is confirmation. The critical question for the Austin housing market forecast is whether the April reading persists through May, June, and July, or whether it registers as a seasonal spike that reverses.
Pending Home Sales Are Up Year Over Year
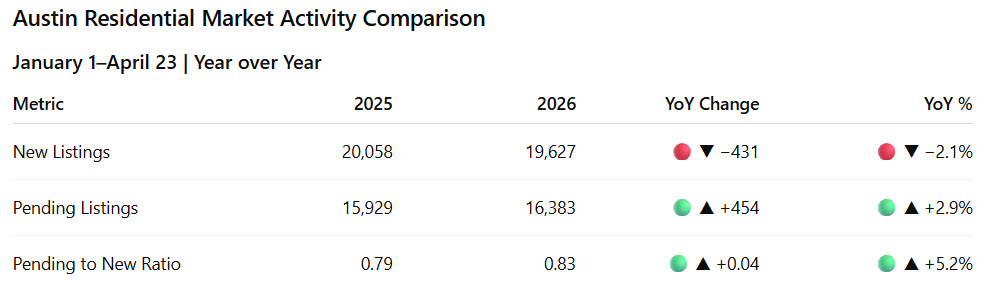
Buyer demand in the Austin real estate market is measurably stronger this year than last year. From January 1 through April 23, 2026, the Austin Area MLS recorded 16,383 pending home sales, compared to 15,929 over the same period in 2025. That is an increase of 454 contracts, or 2.85 percent year over year. In a market where the prevailing narrative has been buyer hesitation, affordability strain, and mortgage rate fatigue, pending contract growth approaching three percent year to date is a meaningful reversal of the 2024 and 2025 trend.
Pending sales are one of the cleanest leading indicators in real estate because they capture the exact moment a buyer and seller agree on terms. They precede closings by roughly 30 to 60 days, which means the demand signal showing up in pending data today will show up in closed sales and reported transaction volume over the next two months. For anyone tracking the Austin housing market update, this is the data point that matters most. More buyers are writing contracts this year than last year, despite a rate environment that has not materially improved.
New Listings Are Contracting, Not Just Decelerating
The supply side of the Austin real estate market is telling an equally important story. Year to date through April 23, 2026, the MLS recorded 19,627 new listings, compared to 20,058 over the same period last year. That is a decline of 431 listings, or 2.15 percent year over year. For more than two years, the dominant supply-side narrative in the Austin housing market has been listings piling up faster than buyers could absorb them. That narrative is changing. New listings are no longer simply decelerating; they are actively contracting year over year.
Active residential inventory currently stands at 16,134 listings, up 1.4 percent year over year, so the cumulative supply picture for the entire MLS is still slightly heavier than a year ago. But active inventory is a stock measure, while new listings are a flow measure. Stocks lag flows. When the inflow of new listings contracts while pending contracts accelerate, the math of the Austin housing market starts to shift toward equilibrium, and active inventory follows within weeks.
City of Austin Months of Inventory Down 13.3 Percent Year Over Year
The absorption picture inside the City of Austin is where the recovery signal is most visible. Months of inventory for the City of Austin currently sits at 5.42, down from 6.25 a year ago. That is a decline of 0.83 months, or 13.3 percent year over year. For the entire MLS, months of inventory is essentially flat at 5.63 versus 5.66 last year, a change too small to call directional. The divergence between the city and the broader metro is meaningful. The urban core is absorbing inventory faster than the suburbs, and that is consistent with the pattern typically seen at the beginning of a cycle turn, when the most desirable submarkets tighten first.
Using the standard absorption classification, below 5 months of inventory signals a seller's market, 5 to 7 months is neutral, and above 7 months is a buyer's market. The City of Austin at 5.42 months and the entire MLS at 5.63 months both sit in neutral territory. But the City of Austin is trending toward the seller's market threshold while the broader metro holds steady. A year ago, City of Austin MOI was firmly in the middle of the neutral band. Today it is pressing against the lower edge.
Why Austin Home Prices Have Not Moved Yet
The most important framing point for anyone tracking Austin home prices and Austin housing market trends is this: pricing is a lagging indicator. In a real estate cycle, the data that shifts first is efficiency, absorption, and contract velocity. Pricing shifts last, sometimes by six to twelve months. What this means is that anyone waiting to see year-over-year Austin home price appreciation before believing in a recovery is watching the wrong variable. By the time prices confirm a turn, the turn is already well underway.
Current data does not yet show broad-based price appreciation across the Austin real estate market. That is not evidence against recovery. That is what early recovery looks like. Efficiency and absorption lead, transaction volume follows, and price movement closes the loop. The MTES reading, the pending sales acceleration, the new listing contraction, and the City of Austin absorption improvement are all leading-indicator data points, and they are all moving in the same direction at the same time for the first time since the 2022 correction began.
Will the Austin Housing Market Crash in 2026?
The short answer, based on the April 2026 data, is no. A market that is absorbing inventory faster than it is producing new listings, with pending sales accelerating year over year and efficiency metrics crossing back into functional range, is not a market in the early stages of a crash. It is a market in the early stages of a recovery. The Austin housing market crash narrative that dominated search queries and headlines through 2023, 2024, and 2025 was grounded in real data at the time: elevated inventory, collapsing efficiency, and declining demand. That data has now shifted.
The risks to the recovery case are real and worth naming. If mortgage rates move meaningfully higher, pending sales growth could stall. If the broader economy weakens, the demand recovery could reverse. If MTES falls back below 14 percent in May or June, the April print will register as a seasonal spike rather than a turnaround. But based on the current data, the probability-weighted path for the Austin real estate market over the next six months is stabilization and early recovery, not continued correction.
What to Watch Over the Next Several Months
The Austin housing market recovery case hinges on whether the April 2026 MTES reading holds and extends. One month at 15.0 percent is a signal. Three to six months inside the 14 to 18 percent range is confirmation. Getting back to genuinely normal Austin market conditions, by the 2012 to 2019 benchmark, requires MTES to climb into the 17 to 20 percent range and hold there, and that is a several-quarter process, not a one-month event.
The critical watch points over the next quarter are whether pending sales growth accelerates beyond the current 2.85 percent year-over-year pace, whether new listings continue contracting, whether City of Austin MOI continues its descent toward the 5-month seller's market threshold, whether active inventory begins rolling over on a year-over-year basis rather than simply flattening, and whether MTES stays inside the 14 to 18 percent band in May, June, and July. If those trends continue, the Austin real estate report for the summer months should show efficiency holding in or above the functional range, months of inventory compressing further, and the first early signs of pricing stabilization in the most competitive submarkets.
Frequently Asked Questions
Will the Austin housing market crash in 2026?
Based on the April 2026 data, no. The Market Turnover Efficiency Score crossed back above 14 percent for the first time in two years, pending home sales are up 2.85 percent year over year, new listings are down 2.15 percent year over year, and City of Austin months of inventory has dropped 13.3 percent year over year. A market absorbing inventory faster than it is producing new listings, with demand accelerating, is not a market in the early stages of a crash. The Austin housing market crash narrative that dominated 2024 and 2025 was grounded in data that has now materially shifted, though a confirmed recovery requires MTES to hold in the functional range for multiple consecutive months.
Is the Austin housing market recovering in 2026?
The April 2026 data shows the first credible early-recovery signal the Austin real estate market has produced in nearly two years. MTES hit 15.0 percent, pending home sales are up year over year, new listings are down year over year, and City of Austin months of inventory has compressed 13.3 percent year over year. However, a reading of 15.0 percent sits at the low end of the functional band. Genuinely normal Austin housing market conditions correspond to MTES readings closer to the 18.94 percent historical average, so current data represents the start of recovery rather than the completion of it.
What are Austin home prices doing right now?
Current data does not yet show broad-based year-over-year Austin home price appreciation, which is consistent with early recovery because pricing is a lagging indicator in real estate cycles. Prices typically shift six to twelve months after efficiency, absorption, and demand metrics turn. The leading indicators, including MTES, pending sales, new listings, and months of inventory, are now all moving in a positive direction, which historically precedes Austin home price stabilization and eventual appreciation by several months. Anyone waiting for price data to confirm a recovery will be late to it.
How many months of inventory does the Austin housing market have right now?
The entire Austin Area MLS currently has 5.63 months of inventory, essentially unchanged from 5.66 a year ago. The City of Austin, measured separately, has 5.42 months of inventory, down sharply from 6.25 a year ago, a decline of 13.3 percent. Both readings fall within the 5 to 7 month neutral range, but the City of Austin is trending toward the 5-month seller's market threshold while the broader metro has held steady. Below 5 months indicates a seller's market, 5 to 7 months is neutral, and above 7 months indicates a buyer's market.
When will it be a buyer's market in Austin?
By the standard absorption classification, the Austin real estate market is currently in neutral territory, with entire-MLS months of inventory at 5.63 and City of Austin months of inventory at 5.42. Neither reading reaches the 7-plus month threshold that defines a buyer's market. More importantly, the trend is moving away from buyer's market conditions, not toward them, with pending sales accelerating, new listings contracting, and City of Austin inventory compressing 13.3 percent year over year. Buyers who have been waiting for maximum leverage should note that the current window is likely narrower than it was six months ago and narrower still than it will be if the April 2026 recovery signal holds.