Austin Real Estate: Where the Best-Value Listings Are Right Now
Published by Team Price Real Estate | Austin Area MLS Percentile Analysis | March 2026
With 13,813 active listings across the Austin area MLS as of March 2026, the question most buyers are asking is not just what things cost — it is where the real deals are hiding. A percentile analysis of active listing prices and price per square foot across 30 Austin-area cities reveals exactly that: specific markets where a measurable number of homes are priced below both the 10th percentile price threshold and the 10th percentile price-per-square-foot threshold simultaneously. Those properties represent the deepest combination of affordability and value density in the current Austin real estate market.
How to Read the Percentile Analysis
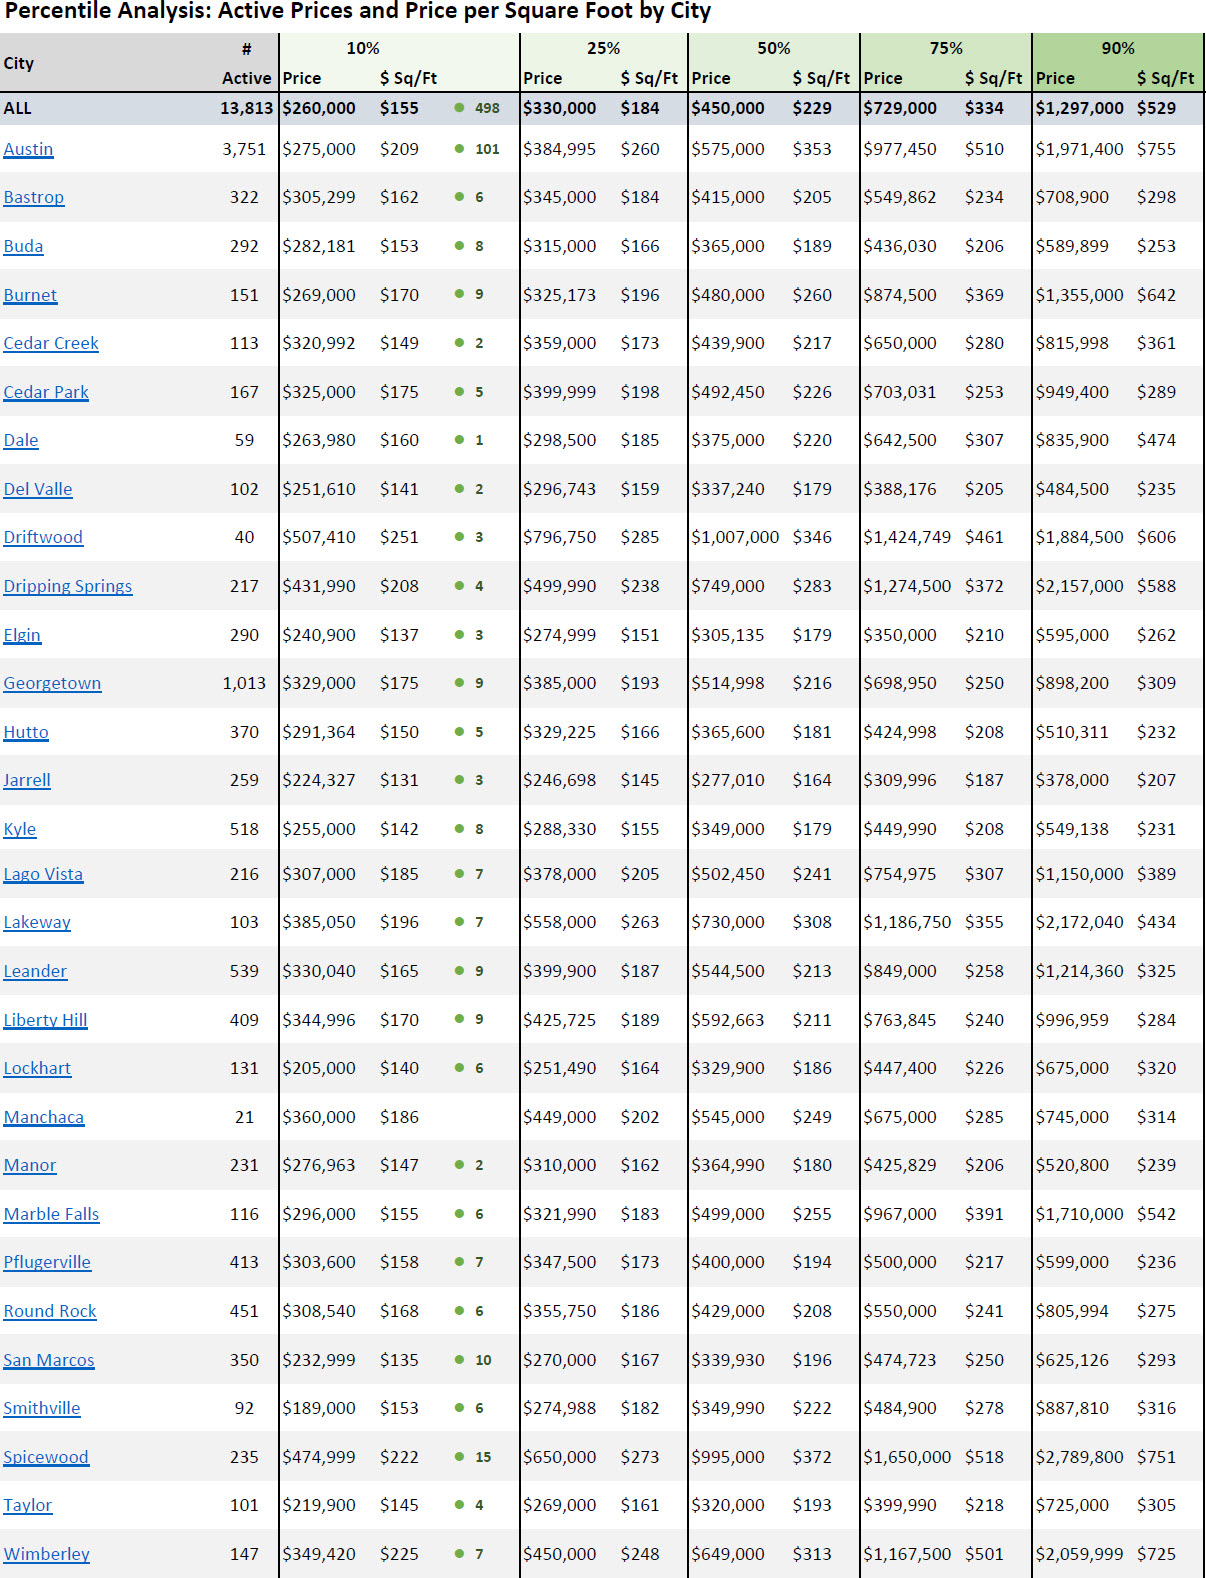
Each city in this analysis is measured across five price percentiles — the 10th, 25th, 50th, 75th, and 90th — for both list price and price per square foot. The 10th percentile means that 10% of active listings in that market fall at or below that price point. Across the entire Austin area MLS, the 10th percentile price is $260,000 and the 10th percentile price per square foot is $155. That means roughly 1,381 of the 13,813 active listings are priced at or under $260,000, and a similar number are priced at or under $155 per square foot.
The value count — the number highlighted alongside the 10th percentile data for each city — identifies properties that qualify on both metrics at the same time: priced below the 10th percentile threshold for list price AND below the 10th percentile threshold for price per square foot. These are the listings that represent the sharpest combination of low total price and strong square footage value. Metro-wide, 498 active listings currently meet that dual threshold.
The Austin Market: Widest Price Range in the Metro
Austin proper leads the metro in both inventory and price range. With 3,751 active listings — more than a quarter of all metro inventory — the city's price distribution spans from a 10th percentile of $275,000 at $209 per square foot all the way to a 90th percentile of $1,971,400 at $755 per square foot. The median active list price in Austin sits at $575,000 at $353 per square foot. That spread of nearly $1.7 million between the 10th and 90th percentile underscores how segmented the Austin housing market is — entry-level and ultra-luxury coexist within the same city boundaries. Currently, 101 Austin listings are priced below both the city's 10th percentile price and price-per-square-foot thresholds simultaneously.
Where Value Density Is Highest: Cities With the Most Dual-Threshold Listings
Spicewood leads all individual cities with 15 listings priced below both its 10th percentile price of $474,999 and its 10th percentile rate of $222 per square foot. That is notable because Spicewood is not a budget market — its median active price is $995,000. Finding 15 listings that simultaneously undercut both value thresholds in a luxury-leaning market suggests meaningful opportunity for buyers targeting high-end properties at discounted entry points.
San Marcos follows with 10 dual-threshold listings, operating from a much more accessible 10th percentile of $232,999 at $135 per square foot — the lowest price-per-square-foot threshold of any city in the analysis. Its median active price of $339,930 makes it one of the most affordable mid-tier markets in the Austin area. Georgetown, one of the largest suburban markets with 1,013 active listings, shows 9 value-density properties against a 10th percentile of $329,000 at $175 per square foot and a median of $514,998.
Burnet, Leander, and Liberty Hill each carry 9 dual-threshold listings. Leander's 10th percentile sits at $330,040 at $165 per square foot with a median of $544,500 — positioning it as a mid-market suburb where value-priced outliers still exist. Liberty Hill's profile is similar at a 10th percentile of $344,996 at $170 per square foot and a median of $592,663. Burnet, a smaller market of 151 listings, shows the wide price range typical of Hill Country communities, with its median at $480,000 and its 90th percentile reaching $1,355,000.
The Most Affordable Entry Points Across the Metro
For buyers focused on the most accessible price points in the Austin property market, several cities stand out at the lower end of the 10th percentile range. Smithville has the lowest 10th percentile list price in the dataset at $189,000 with a $153 per square foot rate, and a median of $349,990 — making it among the most affordable communities tracked. Jarrell follows with a 10th percentile of $224,327 at $131 per square foot, which is the lowest price-per-square-foot entry in the entire dataset at that percentile level, and a median of $277,010. Taylor comes in at $219,900 at the 10th percentile, with a median of $320,000.
Lockhart and Elgin also offer low 10th percentile thresholds at $205,000 and $240,900 respectively. These outer-ring communities reflect the affordability gradient that still exists in the broader Austin real estate market — buyers willing to drive further from the urban core can access substantially lower price points and more square footage per dollar.
The Luxury Tier: Driftwood, Lakeway, and Wimberley
At the opposite end of the spectrum, Driftwood, Lakeway, Spicewood, and Wimberley represent the Austin area's premium communities with the highest median price points. Driftwood's median active list price is $1,007,000 — the only city in the dataset with a median above $1 million — and its 90th percentile reaches $1,884,500 at $606 per square foot. Lakeway's median sits at $730,000 with a 90th percentile of $2,172,040. Spicewood's median of $995,000 and 90th percentile of $2,789,800 at $751 per square foot represents the highest price-per-square-foot ceiling in the entire analysis. Wimberley, with a median of $649,000, reaches $2,059,999 at the 90th percentile — reflecting the premium Hill Country buyers place on that market's lifestyle characteristics.
Dripping Springs shows a similar luxury profile, with a median of $749,000 and a 90th percentile of $2,157,000 at $588 per square foot, while still offering 4 dual-threshold value listings at the entry end. That combination — a luxury median with a handful of value-priced outliers — is a recurring pattern across the Hill Country tier of the Austin housing market.
What This Data Means for Buyers and Sellers
For buyers, the percentile analysis provides a clear-eyed framework for evaluating where their budget positions them within each specific market — not just relative to the metro as a whole. A $400,000 budget puts a buyer at the 25th percentile metro-wide, but places them above the median in markets like Jarrell, Elgin, Manor, and Taylor. The same budget falls below the 25th percentile in Cedar Park, Georgetown, Leander, and Liberty Hill. Understanding that context is essential for setting realistic expectations in today's Austin real estate market.
For sellers, the 50th percentile — the median active list price — is the most useful competitive positioning benchmark. With a metro-wide median active list price of $450,000 at $229 per square foot across 13,813 listings, sellers pricing near or below their city's median are competing for the broadest pool of active buyers. The 498 dual-threshold properties across the metro represent motivated, competitively priced inventory that will draw the highest buyer attention in the current Austin housing market environment.
Percentile Analysis: Active Prices and Price Per Square Foot by City — March 2026
Source: Austin Area MLS | Team Price Real Estate | Data as of March 10, 2026
Value # = Number of listings priced below both the 10th percentile list price AND the 10th percentile price per square foot simultaneously. — = No qualifying dual-threshold listings identified.
Frequently Asked Questions
What does price per square foot tell you about Austin home values?
Price per square foot is one of the most reliable normalizing metrics in real estate analysis because it allows direct comparisons across homes of different sizes. In the Austin area MLS as of March 2026, the metro-wide 10th percentile rate is $155 per square foot and the median is $229 per square foot. A home priced at $450,000 at $200 per square foot represents 2,250 square feet of living space — while a $450,000 home at $300 per square foot delivers only 1,500 square feet. When evaluating Austin home prices, buyers should track both total price and price per square foot to ensure they are comparing equivalent value propositions.
Which Austin suburbs offer the most affordable home prices right now?
Based on March 2026 active listing data, the most affordable suburban markets in the Austin area MLS are Smithville ($189,000 at the 10th percentile), Jarrell ($224,327), Taylor ($219,900), Lockhart ($205,000), and Elgin ($240,900). These communities offer the lowest 10th percentile price thresholds in the metro and also carry some of the lowest price-per-square-foot rates, with Jarrell at $131/sq ft and San Marcos at $135/sq ft representing the deepest value per square foot in the dataset. Buyers willing to extend their search radius from central Austin can access meaningfully lower entry points in these markets.
What is the median home price in the Austin real estate market in 2026?
As of March 2026, the median active list price across the entire Austin Area MLS is $450,000 at $229 per square foot, based on 13,813 active listings. This is the active listing median — the midpoint of what sellers are currently asking — and differs from the average sold price, which reflects completed transactions. The median varies substantially by city, ranging from $277,010 in Jarrell to $1,007,000 in Driftwood. The Austin proper median sits at $575,000, reflecting the city's density of higher-end urban inventory relative to suburban markets.
How do I find undervalued homes in the Austin housing market?
One quantitative approach to identifying undervalued homes in the Austin housing market is to look for listings priced below both the 10th percentile list price and the 10th percentile price per square foot within a given city. This dual-threshold filter screens for homes that are simultaneously low in total cost and efficient in square footage value — meaning buyers are getting more space for less money relative to what the market is pricing. Metro-wide, 498 of 13,813 active listings currently meet this standard. Cities with the highest concentrations of these dual-threshold properties include Spicewood (15), San Marcos (10), Georgetown (9), Leander (9), Liberty Hill (9), and Burnet (9).
What is the difference between the 10th and 90th percentile home price in Austin?
Across the full Austin Area MLS in March 2026, the gap between the 10th and 90th percentile active list price is more than $1 million — from $260,000 to $1,297,000. That spread illustrates how diverse the Austin real estate market is across price tiers. In price-per-square-foot terms, the same spread runs from $155 to $529 per square foot. In individual cities, the range can be even more dramatic: Austin proper spans from $275,000 at the 10th percentile to $1,971,400 at the 90th, while Spicewood runs from $474,999 to $2,789,800. These wide distributions are a defining feature of the Austin property market and reinforce why percentile analysis — rather than averages alone — is essential for informed decision-making.