Is Austin a Buyer's or Seller's Market? A City-by-City Breakdown for March 2026
The Austin real estate market doesn't have one answer to that question right now — it has thirty. Depending on where you're buying or selling within the metro, you could be negotiating from a position of strength as a seller, navigating balanced conditions, or sitting squarely in buyer's market territory with months of inventory to choose from. The March 2026 data across 30 Central Texas cities tells a story of a metro divided almost precisely into thirds.
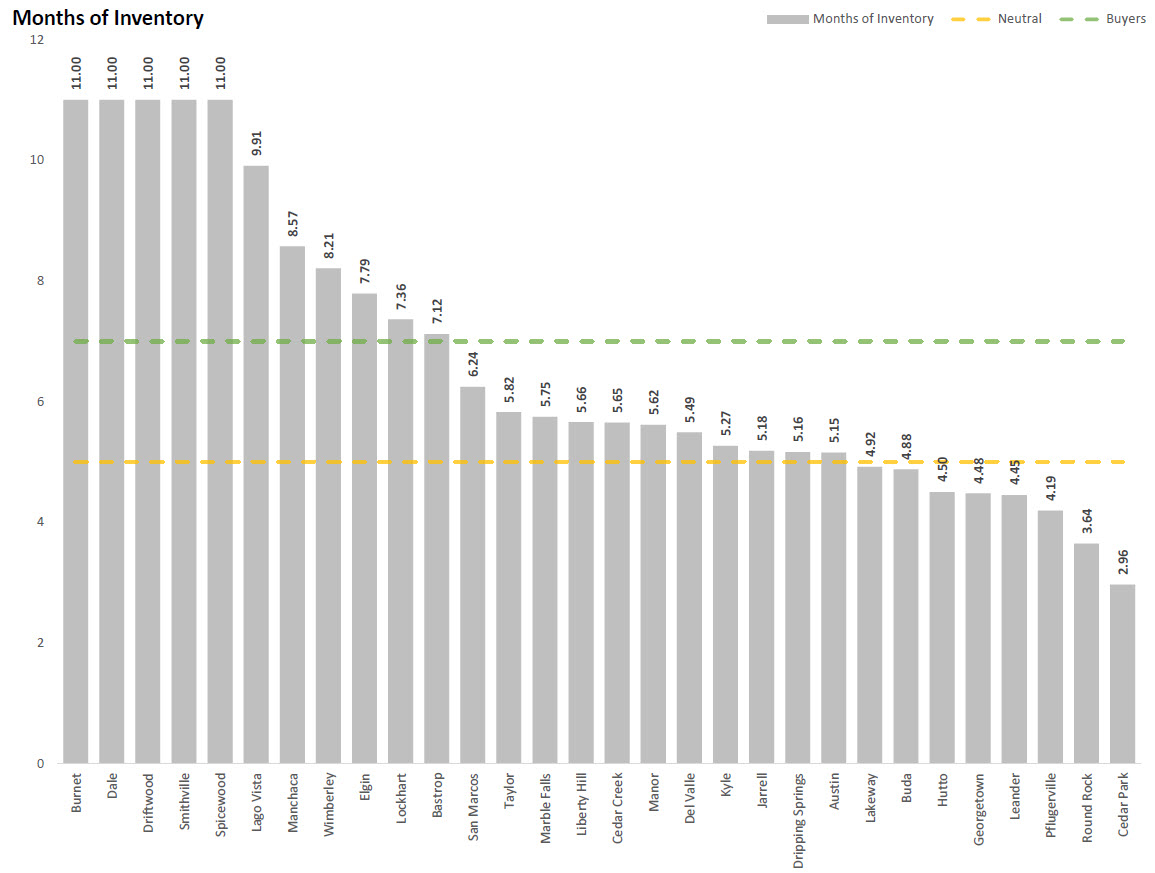
Of the 30 cities tracked, 8 (27%) are currently in seller's market conditions, 11 (37%) are neutral, and 11 (37%) are buyer's markets. The metro median months of inventory sits at 5.65, placing Austin's overall housing market in neutral territory — but that single number masks a dramatic spread from Cedar Park's 2.96 months all the way to five cities locked at the dataset ceiling of 11.00 months.
What is Months of Inventory? Months of inventory measures how long it would take to sell all current active listings at the current pace of sales, assuming no new listings enter the market. Less than 5 months is generally considered a seller's market, 5 to 6.9 months is neutral, and 7 or more months is a buyer's market. It is one of the most reliable indicators of supply and demand balance in any local real estate market.
The Seller's Market Corridor: Eight Cities Where Supply Is Still Tight
The tightest inventory in the Austin metro runs in a concentrated band of established suburban communities. Cedar Park leads the entire metro at just 2.96 months of inventory, with a median sale price of $497,000 and homes moving in a median of 40 days. Round Rock follows at 3.64 months with a $422,739 median price and 49 median days on market. These two cities are the most competitive in the region for buyers, with supply levels that have not meaningfully recovered to neutral despite the broader market's post-2022 correction.
Pflugerville (4.19 months, $408,500 median), Leander (4.45 months, $535,000 median), Georgetown (4.48 months, $514,990 median), and Hutto (4.50 months, $365,865 median) round out the core of the seller's market cluster. All six of these cities sit along or near the US-183 and I-35 corridors north of Austin, where population growth, employment access, and relative affordability have continued to sustain demand above supply. Buda (4.88 months, $365,000 median) and Lakeway (4.92 months, $730,000 median) round out the eight seller's market cities, with Lakeway representing the only high-luxury city in the seller's camp.
Austin Proper: Neutral, But Barely
Austin city proper sits at 5.15 months of inventory with a median price of $570,000 and 3,697 active listings — by far the largest inventory pool in the dataset. At 5.15 months, Austin is technically neutral, but it sits just 0.15 months above the seller's market threshold of 4.9 months. That proximity matters: a modest increase in pending contracts or a slight pullback in new listings could push Austin back into seller's market territory, which is exactly what rising pending counts and falling mortgage rates suggest is possible heading into spring.
Dripping Springs (5.16 months, $744,000 median) and Jarrell (5.18 months, $279,235 median) sit just above Austin in the neutral range, representing the two ends of the price spectrum — luxury hill country acreage and entry-level new construction — both landing in nearly identical supply conditions despite everything else being different about them.
The Neutral Middle: Eleven Cities Balanced Between Buyers and Sellers
The eleven neutral-market cities cover a wide geographic and price range. Kyle (5.27 months, $345,000 median) and Del Valle (5.49 months, $334,495 median) represent affordable suburban options with balanced supply. Manor (5.62 months, $359,090 median) and Cedar Creek (5.65 months, $434,990 median) both land near the metro median, though Cedar Creek's 95 median days on market stands out — homes there are taking significantly longer to go under contract despite the neutral inventory level, a signal of buyer hesitation at that price point in that location.
Liberty Hill (5.66 months, $585,000 median) is worth watching closely. Despite neutral months of inventory, 62.7% of its active listings have already taken a price reduction — the highest rate of any city in the dataset — with an average cut of $53,000. Sellers in Liberty Hill are competing hard. Marble Falls (5.75 months, $499,000 median) and Taylor (5.82 months, $315,615 median) — both with 95-day median DOM — and San Marcos (6.24 months, $342,450 median) complete the neutral tier, with San Marcos approaching the upper boundary of neutral and showing signs of drifting toward buyer's market conditions.
The Buyer's Market Tier: Eleven Cities With Maximum Leverage
Eleven cities have crossed above the 7-month threshold into confirmed buyer's market territory, and the spread within that group is striking. Bastrop (7.12 months, $412,500 median) and Lockhart (7.36 months, $330,000 median) sit just above the line, while five cities — Burnet, Dale, Driftwood, Smithville, and Spicewood — are all at 11.00 months, the maximum reading in the dataset.
The outer-ring and rural markets dominate this tier. Lago Vista (9.91 months, $512,500 median), Wimberley (8.21 months, $635,000 median), and Elgin (7.79 months, $305,135 median) all reflect markets where pandemic-era demand has receded significantly. Driftwood stands out as an unusual data point: 11.00 months of inventory, a $974,000 median price, but only 42 median days on market — suggesting that when a correctly priced luxury property comes to market there, it moves, but the pipeline of overpriced or stale inventory is creating the high MOI reading.
Manchaca presents the most interesting anomaly in the dataset. At 8.57 months of inventory, it is technically a deep buyer's market — yet its median days on market is just 33, the lowest of any buyer's market city and among the lowest in the entire dataset. With only 20 active listings, this is a small-sample-size market where individual sales move the metrics dramatically. Buyers in Manchaca have leverage on paper, but well-priced homes are not sitting.
The Price Reduction Picture
Across the entire MLS, 47.34% of the 13,747 active listings have taken at least one price reduction, with an average cut of $59,000 — a 7.3% reduction from original list price. Only 2.85% of listings have seen price increases, averaging $19,000. The math is clear: sellers are adjusting downward far more often than upward, and the average reduction is more than three times the average increase.
The cities with the highest price reduction rates tend to be the ones experiencing the tension between elevated supply and price anchoring from the 2021–2022 peak. Liberty Hill (62.7%), Lockhart (57.0%), Kyle (56.8%), and Hutto (56.5%) all have more than half their active inventory showing cuts, even as some of those cities remain technically in or near seller's market territory. Sellers in these cities listed high and are being pulled back to market by buyer demand that doesn't support those original ask prices.
What This Means for Buyers and Sellers in March 2026
For buyers, the data is clear about where leverage exists. The 11 buyer's market cities — particularly Lago Vista, Wimberley, Bastrop, Elgin, and the five cities at 11.00 months — offer negotiating power that simply does not exist in the northwest suburban corridor. The 47.34% price reduction rate across the MLS means that patience and willingness to negotiate are being rewarded in a way they haven't been since 2019.
For sellers, location is everything in March 2026. If you are listing in Cedar Park, Round Rock, Pflugerville, Leander, or Georgetown, you are operating in a market where supply is still constrained and correctly priced homes are moving in under 60 days. If you are listing in a buyer's market city, the data demands pricing discipline — not from list, but from recent comparable sales. The 47.34% price reduction rate is a direct measure of what happens when sellers don't.
The metro median of 5.65 months tells you the overall market is balanced. The individual city data tells you which side of that balance you're actually on.
Frequently Asked Questions
What does months of inventory mean in real estate?
Months of inventory is a measure of how long it would take to sell all currently active listings at the existing pace of sales, assuming no new homes are added to the market. It is calculated by dividing the number of active listings by the average monthly sales rate. In Austin real estate, fewer than 5 months of inventory signals a seller's market, 5 to 6.9 months is considered neutral or balanced, and 7 or more months indicates a buyer's market where supply exceeds demand and buyers have greater negotiating leverage.
Which Austin-area cities are currently in a seller's market?
As of March 2026, eight cities in the Austin metro are in seller's market conditions with fewer than 4.9 months of inventory. Cedar Park leads at 2.96 months, followed by Round Rock (3.64), Pflugerville (4.19), Leander (4.45), Georgetown (4.48), Hutto (4.50), Buda (4.88), and Lakeway (4.92). These cities are concentrated in the northern and northwestern suburbs, where demand has remained consistently strong relative to available supply.
Is Austin a buyer's or seller's market right now?
The overall Austin housing market is currently neutral, with a metro median of 5.65 months of inventory as of March 2026. However, 27% of tracked cities are in seller's market territory and 37% are in buyer's market territory, meaning the answer depends heavily on which specific city and price range you are looking at. The northwest suburban corridor remains competitive for sellers, while outer-ring and rural markets offer significant buyer leverage.
Why do so many Austin homes have price reductions right now?
Across the entire Austin MLS, 47.34% of active listings have taken at least one price reduction, with an average cut of $59,000. This reflects the tension between seller price expectations — many of which are still anchored to the 2021–2022 peak — and current buyer demand, which is constrained by mortgage rates that remain above 6%. Cities like Liberty Hill (62.7% of listings with cuts) and Kyle (56.8%) illustrate how even markets with relatively tight inventory are seeing sellers adjust to meet buyers where they actually are.
What is the difference between months of inventory and days on market?
Months of inventory measures supply relative to demand at a market-wide level — it tells you how balanced the overall market is. Days on market measures how long individual listings sit before going under contract — it reflects buyer urgency and pricing accuracy at the property level. A city can have high months of inventory (deep buyer's market) but low days on market, as Manchaca illustrates at 8.57 months but only 33 median days. This happens when a small total pool of listings includes a few well-priced homes that sell quickly while others sit, skewing both metrics simultaneously.
Data as of March 6, 2026. Published by Team Price Real Estate. For the full city-by-city breakdown and weekly Austin market updates, visit teamprice.com/insight-and-statistics.