Austin Real Estate Market
Activity Index Hits Highest Level Since April 2025 — And It's Still Climbing
Something is shifting in the Austin housing market — and the data is hard to ignore. As of March 3, 2026, the Austin real estate market's Activity Index sits at 24.0%, the highest reading recorded since April 30, 2025. What makes this number especially significant is not just where it is, but the direction it's heading. While last year's Activity Index was already declining by the first week of March 2025, this year's figure is still moving upward. That divergence tells a meaningful story about where the Austin property market may be headed in the days ahead.
The Activity Index measures the ratio of pending contracts to total active and pending listings. It is widely regarded as one of the most reliable leading indicators available in real estate market analysis. When the index rises, it signals that buyers are actively committing to purchases relative to the pool of available homes — a strong early signal of demand health in the Austin real estate market before that demand shows up in closed sales data.
How 2026 Is Tracking Against Recent History
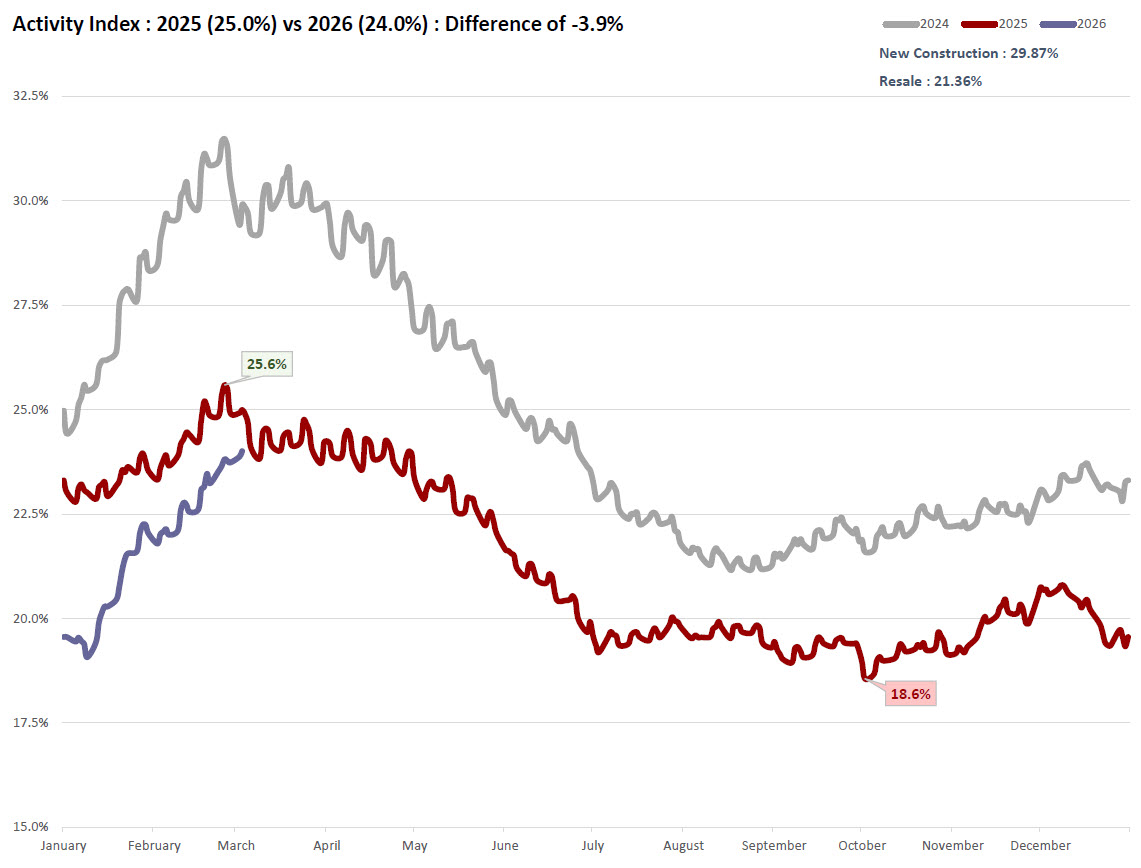
To understand why the current reading is notable, it helps to look at how the Austin housing market has behaved over the past two years. In both 2024 and 2025, the Activity Index peaked around February 25th and then declined consistently through the spring and summer months, bottoming out somewhere between August and October. That seasonal pattern is well-established in Austin real estate trends, driven by a combination of inventory expansion in the spring and buyer fatigue heading into late summer.
In 2026, the index has not yet peaked — at least not as of today. While last year's Activity Index was already on its way down during the first week of March 2025, this year's reading is still trending upward. The current 2026 figure of 24.0% sits just -3.9% below the comparable 2025 level. Given that gap and the current upward momentum, the Austin real estate forecast is that 2026 will surpass last year's Activity Index figure within the next few days, assuming present conditions hold.
Pending Sales: The Engine Behind the Numbers
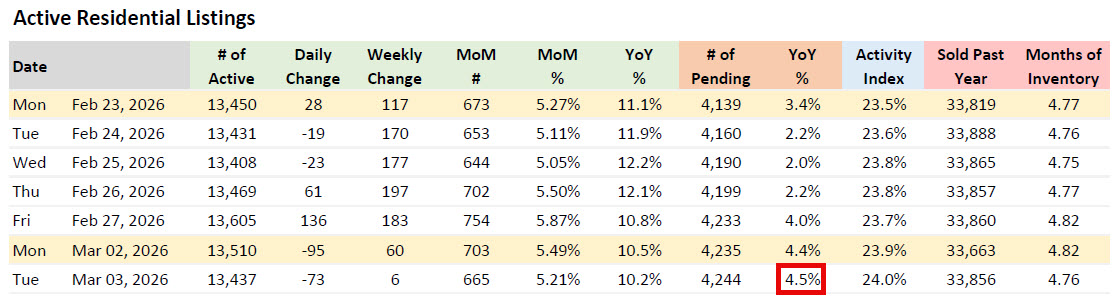
The fuel driving the Activity Index higher is a surge in pending contracts. As of today, there are 4,244 pending sales across the Austin market — a 4.5% increase year over year compared to the same date in 2025. That year-over-year gain is the largest recorded going back to August 28, 2025, meaning buyers are committing to purchases at a pace not seen in more than six months. In a market that has faced persistent affordability pressures and elevated mortgage rate uncertainty, this level of contract activity represents a meaningful signal.
The pending count is moving in a direction that the broader Austin housing trends narrative has not yet fully captured. When over 4,200 buyers are under contract simultaneously, that reflects genuine demand — not speculative noise. These are real transactions in process, and their year-over-year acceleration adds credibility to the case that Austin home prices and market activity may hold firmer ground in early 2026 than many expected heading into the year.
New Listings Are Lagging — And That Changes the Equation
One of the key structural factors pushing the Activity Index higher is that new listings are running below last year's pace. When fewer homes come onto the market, the ratio of pending contracts to total inventory naturally improves — and the Activity Index reflects that. This supply-demand dynamic is critical context for interpreting the current Austin housing market update. It is not simply that more buyers are active; it is also that there are fewer available homes absorbing that demand, which concentrates pending activity relative to the total listing pool.
New construction represents 29.87% of total active residential listings, while resale accounts for 21.36% of the Activity Index reading on the resale side. The new construction segment continues to play a significant role in the Austin property market, but even with that supply contribution, overall new listing volume has not kept pace with 2025 comparables. That gap is giving the Activity Index room to expand in a way that has not been seen at this point in the year for at least two years.
What the Activity Index Is Telling Us
As a leading indicator, the Activity Index offers a window into where the Austin real estate market is heading before that direction becomes visible in lagging metrics like median sales price or closed volume. The current reading of 24.0% — still climbing, still above the trajectory of the past two years at this same point in the calendar — suggests that early 2026 demand is more resilient than prior-year patterns would have predicted.
If the index does exceed last year's comparable figure in the coming days, it will mark the first time in recent history that the Austin housing market has outpaced the prior year's Activity Index at this stage of the spring cycle. That would be a meaningful data point for anyone tracking Austin real estate trends, particularly given the macroeconomic headwinds — including mortgage rates that remain elevated relative to the pre-2022 era — that many analysts expected would continue suppressing activity.
The Austin real estate report forming in real time suggests that the spring selling season may carry more momentum than initially anticipated. Whether that momentum sustains through April and May — historically the busiest months in the Austin market — will depend on whether new listing inventory expands to meet buyer demand or remains constrained, keeping the Activity Index elevated. For now, the data points clearly: buyers are active, contracts are being signed, and the leading indicators are moving in a direction that warrants close attention.
Frequently Asked Questions
What is the Activity Index in real estate and why does it matter?
The Activity Index is a leading indicator that measures the percentage of pending contracts relative to total active and pending listings in a given market. In the Austin real estate market, it is used to gauge buyer demand before that demand shows up in closed sales data. A rising Activity Index indicates that buyers are actively committing to purchases at a faster rate than new inventory is entering the market. Because it reflects contracts in progress rather than completed transactions, it provides an early signal of where Austin housing trends are heading — often several weeks before those trends become visible in median price or volume data.
What does a 24.0% Activity Index mean for the Austin housing market?
A 24.0% Activity Index means that roughly 24 out of every 100 residential listings in the Austin market currently have a pending contract attached to them. In the context of Austin real estate trends, this reading represents the highest level recorded since April 30, 2025, and its continued upward trajectory in early March 2026 — while the same period in 2025 was already declining — makes it particularly noteworthy. It signals that buyer demand relative to available supply is firming, which historically has been a precursor to stabilizing or rising Austin home prices in the near term.
Why are pending home sales up 4.5% year over year in Austin?
The 4.5% year-over-year increase in pending sales — bringing the total to 4,244 as of March 3, 2026 — reflects a combination of factors shaping the Austin real estate market. New listing inventory has been running below last year's pace, concentrating buyer activity among a smaller pool of available homes. At the same time, buyers appear to be engaging with the market more decisively, possibly motivated by concerns about affordability worsening further if rates or prices move higher. This is the largest year-over-year pending gain recorded since August 28, 2025, making it the most significant positive demand signal in the Austin housing market report in months.
How does 2026 compare to 2024 and 2025 in the Austin real estate market?
In both 2024 and 2025, the Austin market's Activity Index peaked around February 25th and declined through summer, bottoming between August and October. In 2026, the index has not yet peaked as of early March and remains only -3.9% below last year's comparable figure — despite 2025 already being in decline at this point in the calendar. The full-year Activity Index average for 2025 was 25.0% versus 2026's current reading of 24.0%, but given the upward trajectory, the Austin real estate forecast suggests 2026 may eclipse last year's reading for this period within days, marking a meaningful divergence from the established seasonal pattern.
What is the difference between new construction and resale in Austin's Activity Index?
New construction accounts for 29.87% of the current Activity Index reading, while resale properties reflect a 21.36% rate. This gap indicates that newly built homes are moving under contract at a significantly higher pace relative to their available inventory than resale properties. In the Austin property market, this is consistent with recent years, as new construction has offered buyers access to rate buydowns, builder incentives, and move-in-ready product that resale listings cannot always match. Both segments are contributing to the overall 24.0% Activity Index, and the resale market's pending growth — particularly the 4.5% year-over-year gain in total pendings — suggests that resale demand is strengthening alongside new construction activity.