"How's the Austin Market?" Depends on Whether You're in 78739 or 78705
Ask five people in Austin how the housing market is doing and you will get five different answers. That is not because they are paying attention to different news sources. It is because they live in different zip codes, and the Austin housing market has fractured so sharply that a single honest answer no longer exists at the metro level. The only question that actually matters for a buyer, seller, or investor right now is which zip code they are standing in when they ask.
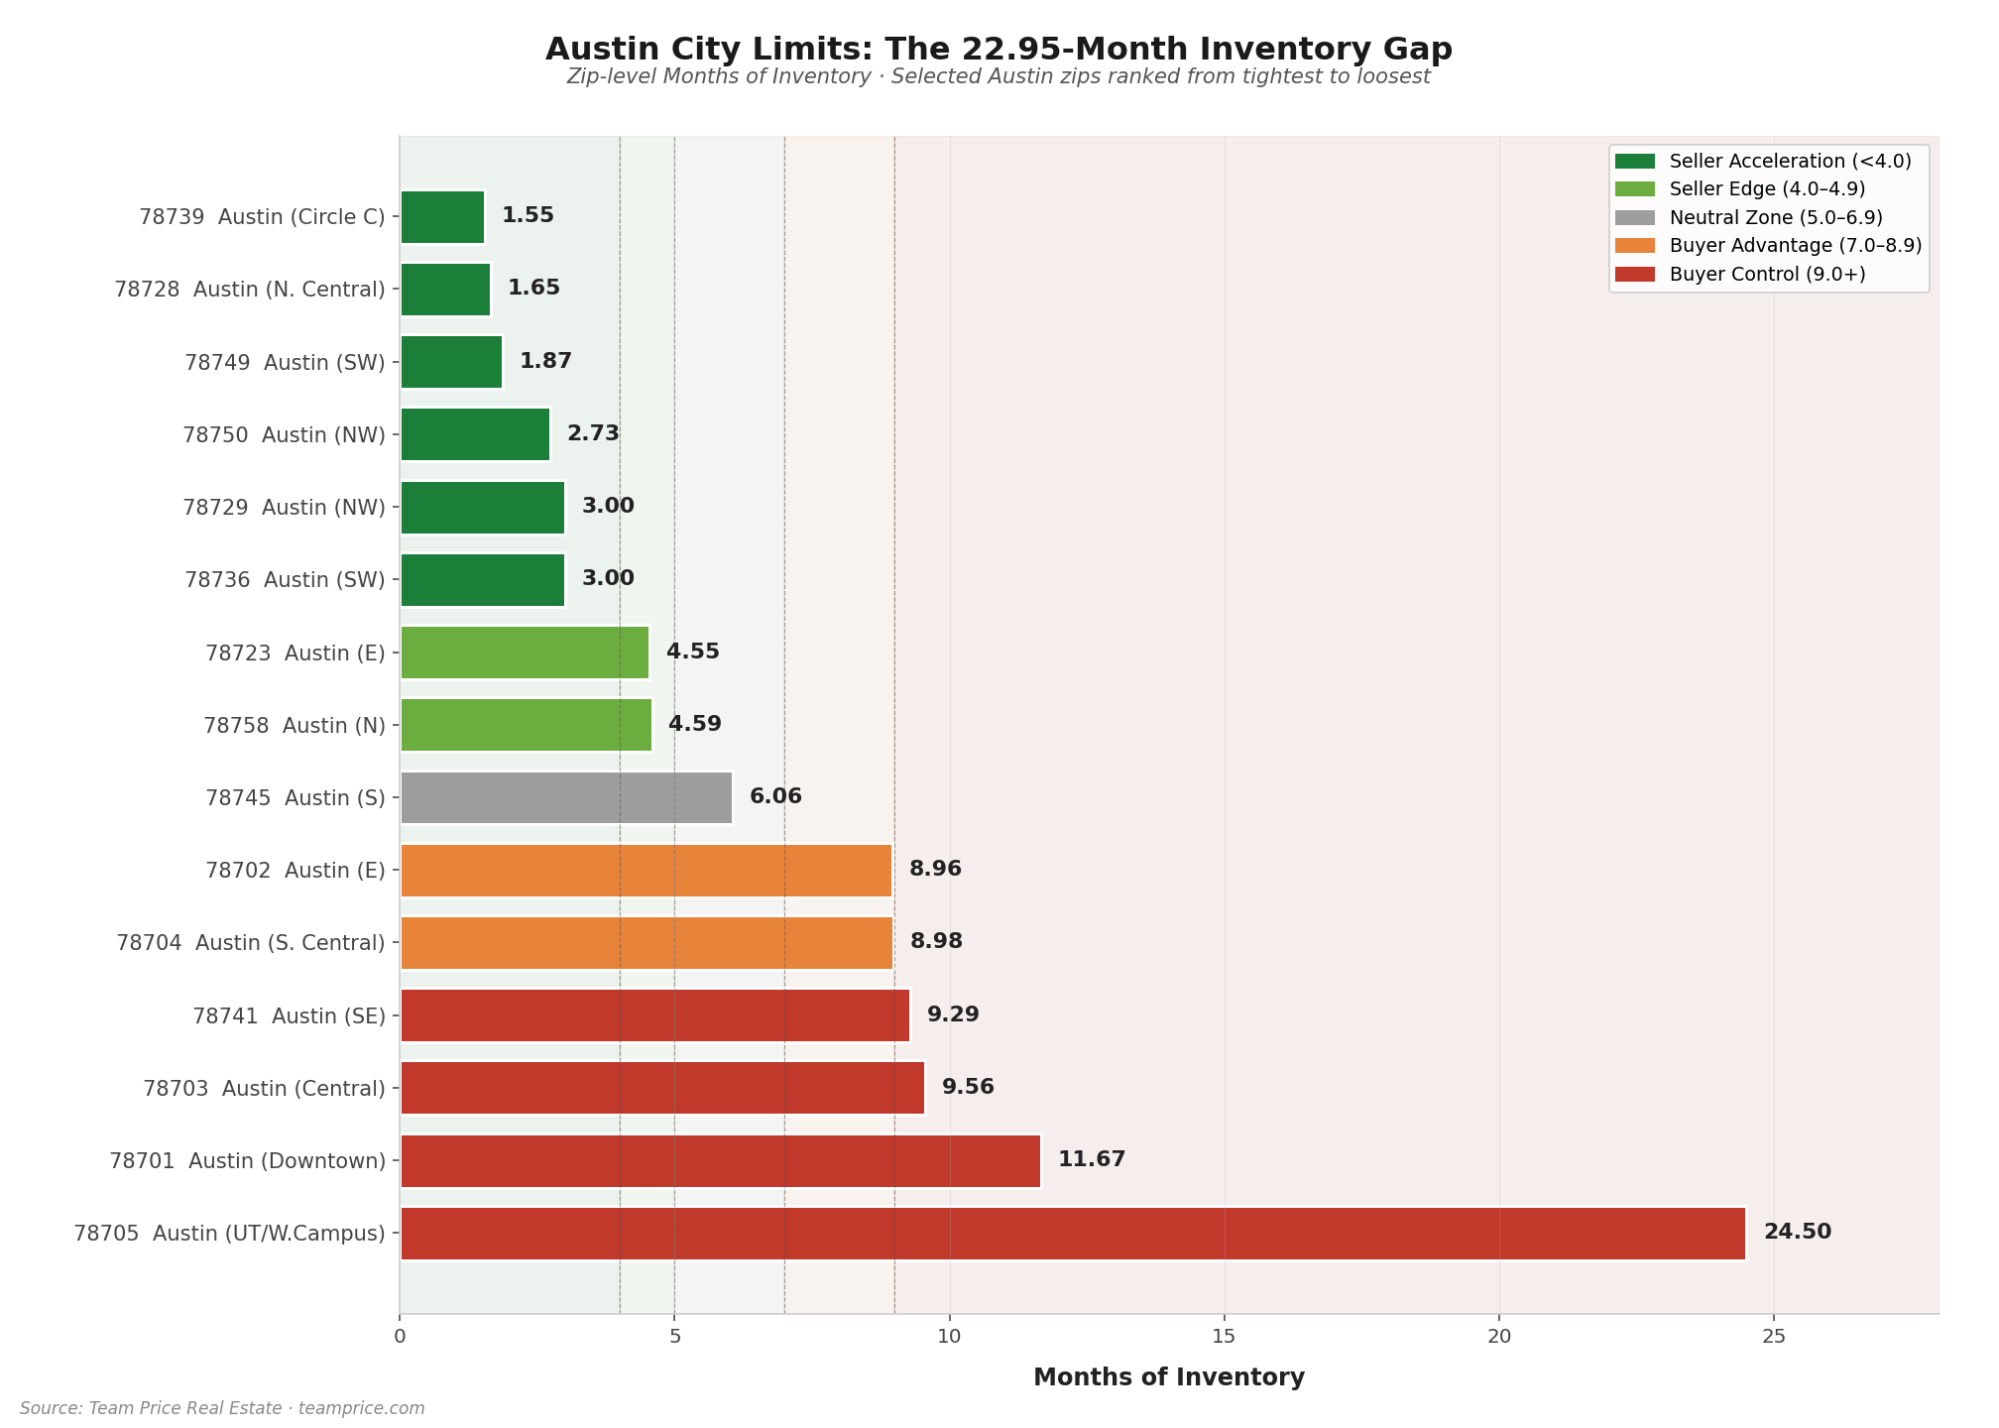
To see how wide the gap has become, pull two Austin zip codes off the same list and put them side by side. Zip code 78739, anchoring Circle C Ranch in far southwest Austin, is running at just 1.55 months of inventory. Zip code 78705, the stretch of central Austin wrapped around the University of Texas and the West Campus blocks along Guadalupe Street, is sitting at 24.50 months of inventory. That is a 22.95-month spread. Same city, same mayor, same MLS, same property tax jurisdiction. Two completely different Austin real estate markets, ten miles apart as the crow flies.
What Months of Inventory Actually Measures
Before looking at why the two zip codes have split, it helps to know what the number represents. Months of Inventory, or MOI, measures how long it would take to sell every active listing at the current pace of sales. Low numbers mean demand is soaking up supply fast and sellers have the upper hand. High numbers mean listings are stacking up faster than buyers are pulling them off the shelf, and pricing power shifts to the buyer.
Team Price Real Estate reads MOI across five tiers. Below 4.0 months is Seller Acceleration, where homes move quickly and prices push up. The 4.0 to 4.9 band is Seller Edge, with tight supply and upward pressure on prices. The 5.0 to 6.9 range is the Neutral Zone, where supply and demand are roughly balanced and pricing tends to hold steady. From 7.0 to 8.9 is Buyer Advantage, where rising inventory begins handing leverage to buyers. Anything 9.0 months or higher is Buyer Control, where excess supply starts pulling prices down. Against that framework, 78739 is running at less than half the Seller Acceleration threshold. And 78705 is running at nearly three times the floor of Buyer Control. These are not close calls or edge-of-category readings. They are the extremes.
78739: Circle C Ranch and the Southwest Austin Squeeze
Zip code 78739 is the tightest reading on the 75-zip Austin-area list. At 1.55 months of inventory, it leads a short cluster of ultra-tight zips that includes 78728 at 1.65 months and 78749 at 1.87 months. What sits inside 78739 explains why. This is the heart of Circle C Ranch, a master-planned community of more than 5,600 homes developed on what was originally Texas ranch land. The zip code is anchored by highly-rated Austin ISD schools including Kiker Elementary, Gorzycki Middle, and Bowie High School, and the Circle C amenity network of pools, parks, greenbelts, and the Veloway pulls in family buyers who are willing to commit to a specific school feeder pattern and a specific lifestyle.
That kind of buyer behavior produces a particular signature in the data. When demand concentrates around a defined set of schools, amenities, and commutable single-family inventory, the Austin real estate market inside that zip code behaves like it did during the peak demand cycles of recent years, regardless of what the broader metro numbers look like. At 1.55 months of inventory, sellers in 78739 are operating with pricing power that would surprise anyone reading only the headline figures for the Austin housing market. Well-priced listings in Circle C are not sitting. They are being absorbed almost as fast as they come on.
78705: UT, West Campus, and the Austin Market's Biggest Overhang
Ten miles north, the picture inverts completely. Zip code 78705 covers the University of Texas and the dense West Campus blocks where historic bungalows, 1970s and 1980s condo stock, and newer high-rise student apartments sit shoulder to shoulder. At 24.50 months of inventory, it is the highest reading on the entire 75-zip list. The next-highest zip, 78669 in Spicewood, comes in at 15.17 months. After that, 78957 in Smithville at 14.43. The drop from 78705 to the second-place zip is nearly ten full months of inventory, which is a separation that points to something structural rather than cyclical.
The 78705 housing stock is tilted heavily toward condos and small-footprint units that have historically been fed by investor demand tied to student rentals. When the math on that category of property shifts, whether because of lending conditions, rental yield compression, insurance costs, or changes in the pool of buyers willing to underwrite student-tenant risk, the inventory overhang can get dramatic quickly. And that is exactly what 24.50 months of inventory reveals. The current pool of buyers in 78705 cannot absorb the current pool of listings at anything close to a normal pace. Even with the zip code's unbeatable location next to campus and downtown, the supply-demand balance has tipped firmly to the buyer's side.
The Metro Average Hides the Real Austin Market
This is why the question "how's the Austin housing market doing?" has stopped having a useful single answer. Of the 75 Austin-area zip codes tracked, 19 are sitting in Seller Acceleration below 4.0 months of inventory, and another 13 are in the Seller Edge band between 4.0 and 4.9 months. That is roughly 42 percent of zip codes operating as seller's markets right now. At the same time, 13 zip codes are in Buyer Control at 9.0 months or higher, and another 11 are in Buyer Advantage between 7.0 and 8.9 months. Nearly a third of the list is a buyer's market. Only about 25 percent of Austin zip codes are in the Neutral Zone.
The split is not subtle, and it is not limited to the two extremes. Zip code 78702 on Austin's east side runs 8.96 months while 78723, a few blocks north, runs 4.55. Zip code 78704 in South Austin runs 8.98 while 78745 next door runs 6.06. Zip code 78703 in west-central Austin runs 9.56 while 78736 in far southwest Austin runs 3.00. The Austin real estate forecast for any individual buyer or seller depends far more on their specific zip code than on any headline number published for the metro.
What Sellers and Buyers Should Take From This
For sellers, the takeaway is blunt. Pricing strategy cannot be imported from the zip code next door. A home in 78739 that prices aggressively is likely to move quickly because demand is stacked up against limited supply. A home in 78705 priced on the same logic will sit for months because supply is stacked up against limited demand. Same Austin housing market, two entirely different pricing environments.
For buyers, leverage exists but it exists unevenly across the map. Buyers who are flexible on location will find meaningful concessions available in zip codes running at 9.0 months or higher. Buyers locked into zips like 78739, 78728, or 78749 should plan to compete, often against multiple offers, and should structure their financing and offer strategy accordingly.
The broader Austin housing market update is no longer a single story. It is dozens of simultaneous stories, each with its own supply, demand, and pricing arc. The 22.95-month gap between 78739 and 78705 is the cleanest reminder that Austin real estate trends have to be read at the zip code level to mean anything useful. Metro averages are not wrong exactly. They are just too blurry to act on.
Frequently Asked Questions
What is considered a healthy months of inventory in the Austin real estate market?
A healthy or balanced Austin housing market typically lands in the 5.0 to 6.9 months of inventory range, which Team Price Real Estate classifies as the Neutral Zone. In this band, supply and demand are roughly balanced and pricing tends to hold steady. Readings below 5.0 months signal upward pressure on Austin home prices, while readings above 7.0 months signal downward pressure. Right now, only about 25 percent of the 75 Austin-area zip codes tracked are sitting in that balanced range, with the remainder split between seller-favored and buyer-favored conditions.
Why do months of inventory vary so much between Austin zip codes?
Zip-level Months of Inventory reflects highly localized supply and demand, including school district desirability, commute patterns, housing stock composition, and the mix of investor versus owner-occupant buyers. Austin real estate trends in a family-oriented master-planned community like Circle C Ranch in 78739 look nothing like trends in a student-adjacent condo-heavy market like West Campus in 78705, even though both sit inside Austin city limits. Investor demand, rental yield math, insurance costs, lending conditions, and the flow of new construction all feed into zip-specific MOI readings, which is why metro-wide averages routinely miss what is actually happening on the ground.
Is the Austin housing market a buyer's market or a seller's market right now?
It depends entirely on the zip code, which is why a single metro-wide answer no longer reflects reality. Roughly 42 percent of the 75 Austin-area zip codes tracked are running as seller's markets under 5.0 months of inventory, while about 32 percent are running as buyer's markets at 7.0 months or higher. The remaining 25 percent sit in neutral territory. Any honest Austin housing market update has to acknowledge that the metro is not moving as a single unit, and sweeping buyer-market or seller-market claims at the Austin level misrepresent what the zip-level data shows.
What does 24.50 months of inventory mean in practical terms for a seller in 78705?
At 24.50 months of inventory, it would take more than two years to sell every currently active listing in 78705 at the current pace of sales, assuming no new listings arrive. In practice, it means sellers in that zip code are competing for a small pool of buyers and pricing power has swung hard in the buyer's favor. Homes priced to prior-peak valuations are unlikely to move without meaningful adjustments, concessions, or longer days on market. Realistic pricing, strong marketing, and a willingness to negotiate are essential for anyone trying to sell in an Austin property market this soft.
How often do Austin months of inventory numbers change, and should I track them monthly?
MOI updates every month as new MLS sales and listing data is processed, and readings can shift meaningfully from one reporting cycle to the next, particularly in smaller-volume zip codes. For anyone actively buying or selling in the Austin housing market, monthly zip-level tracking is far more useful than quarterly or annual metro averages. Zip-level MOI is one of the most reliable early indicators of where Austin home prices are headed next in a specific neighborhood, which is why it sits at the core of any serious Austin real estate forecast.