Austin Housing Inventory Sits at 4.92 Months — Sellers Still Have the Edge, but Barely
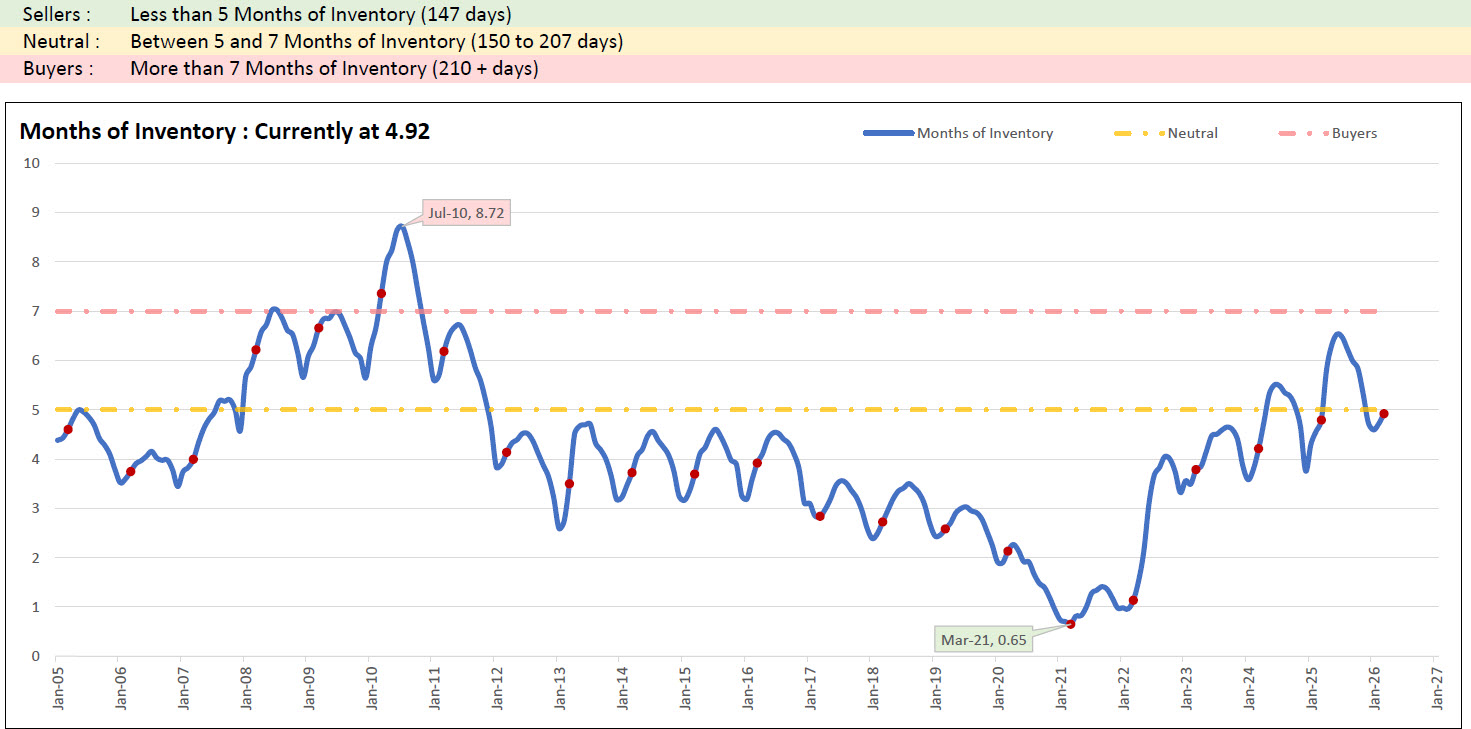
The Austin real estate market is sitting at a critical inflection point. As of March 2026, the Austin area has recorded 4.92 months of housing inventory — keeping the market technically in seller's market territory, but by the thinnest margin in recent memory. With a neutral market defined as anything between 5 and 7 months of inventory, Austin is just 0.08 months away from crossing that line. For buyers, sellers, and anyone tracking austin real estate trends, this reading carries significant weight.
Months of inventory measures how long it would take to sell every active listing on the market at the current pace of sales — assuming no new homes were listed. A reading below 5 months (147 days) favors sellers. A reading between 5 and 7 months (150 to 207 days) is considered neutral. Anything above 7 months (210-plus days) tips into buyer's market territory. At 4.92, Austin remains in the seller's column, but the gap to neutral has never been this narrow in a non-crisis period.
How We Got Here: From 0.65 to 4.92 in Five Years
To understand where the austin housing market stands today, it helps to see where it has been. In March 2021, Austin recorded the lowest months of inventory ever measured in this dataset — a remarkable 0.65 months. That figure represented an extreme seller's market unlike anything the metro had experienced, fueled by a surge of in-migration, remote work relocation, and historically low mortgage rates. At that level, the average home was effectively spoken for before it even hit the market.
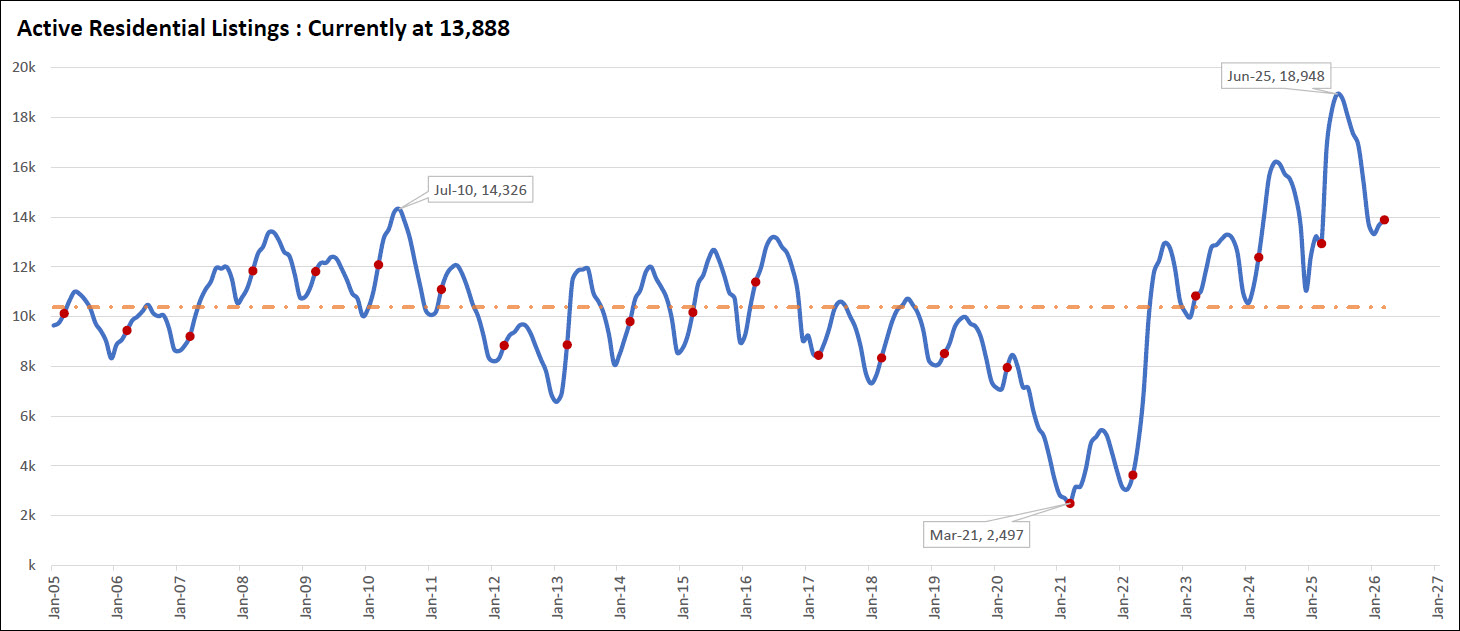
The market then swung sharply in the other direction. As interest rates climbed through 2022 and into 2023, buyer demand cooled and active listings began piling up. By June 2025, inventory had reached 6.53 months — firmly in neutral territory and approaching the buyer's market threshold. Active residential listings peaked at 18,948 in June 2025, the highest count in this dataset's history, surpassing even the post-2008 peak of 14,326 recorded in July 2010.
Since that June 2025 peak, inventory has been contracting. The current active listing count stands at 13,888 — down meaningfully from that record high. The month-over-month MOI readings for early 2026 reflect that compression clearly: January came in at 4.59, February at 4.72, and March at 4.92. While March ticked slightly higher than February, the broader trend over the past nine months has been a market pulling back from its inventory peak toward something more balanced — and now pushing back toward seller's conditions.
Year-Over-Year Context: The Market Is Tightening
Comparing this March to prior years reveals a consistent tightening trend. March 2021 was 0.65. March 2022 came in at 1.13 as rates began their ascent. By March 2023, inventory had jumped to 3.79 as the higher-rate environment suppressed buyer activity and listings built up. March 2024 reached 4.21, and March 2025 hit 4.79 — just 0.13 months below where we are today.
That year-over-year movement from 4.79 in March 2025 to 4.92 in March 2026 represents a 0.13-month increase — a modest uptick compared to the dramatic swings seen in prior years. This relative stability suggests the austin housing market may be settling into a new equilibrium zone, hovering just below the seller-to-neutral threshold as supply and demand find their footing.
The longer historical context also matters here. Before the pandemic distorted conditions in both directions, March readings from 2005 through 2019 ranged from roughly 2.44 to 6.66. The current reading of 4.92 falls comfortably within that pre-pandemic band — closer to the tighter end, but not at an extreme. In that sense, today's austin real estate market is beginning to resemble something like a pre-2020 normal.
What 4.92 Months of Inventory Means for the Austin Housing Market
For sellers, a reading of 4.92 months still means the market leans in their favor. Homes that are priced correctly and presented well are generally selling. Competition among buyers has not evaporated. But sellers no longer enjoy the overwhelming leverage of 2021, when a 0.65-month reading meant buyers were often waiving inspections, flooding listings with offers, and bidding prices well above asking.
For buyers, the current environment represents a meaningful improvement over the recent past — more choices, more negotiating room, and far less pressure than the pandemic era. Inventory at 13,888 active listings gives buyers options. The market is not wide open the way it was in 2010 when 14,326 listings were available and inventory sat near 8.72 months, the highest recorded in this dataset. But relative to 2021 and 2022, today's buyers have substantially more breathing room.
The 0.08-month gap between the current reading and a neutral market is not just a number — it represents the direction the austin property market may be heading. If inventory continues its seasonal increase through spring and summer, as it typically does, there is a realistic path to the market briefly touching neutral conditions in 2026 before any potential pull-back in the fall. Conversely, if listing volume remains constrained, the seller's edge could hold or even deepen.
Historical Perspective: The Extremes That Frame Today's Market
The two reference points that best frame the current austin real estate report are July 2010 and March 2021. The July 2010 peak of 8.72 months came in the aftermath of the 2008 financial crisis, when a flood of distressed properties and collapsed buyer demand pushed inventory to historic highs. That was as deep a buyer's market as Austin has ever seen in modern data. The March 2021 trough of 0.65 was the mirror extreme — a supply-demand imbalance so severe that the market could clear every listing in under three weeks.
At 4.92, the current austin market sits almost exactly between those two poles — closer to the tighter end, but nowhere near either extreme. This middle-ground position is actually where healthy, functioning real estate markets tend to operate over the long run. The violent swings of the past five years appear to be normalizing, and the data increasingly supports the view that Austin is working its way back toward a sustainable equilibrium.
Active listings at 13,888 — down from the June 2025 record of 18,948 — also suggest that the supply surge of 2024 and early 2025 is being absorbed. Whether that absorption continues at a pace that keeps sellers in control, or whether new listings outpace demand and push inventory back toward neutral, will define the austin real estate forecast for the remainder of 2026.
Looking Ahead: Where Does Inventory Go From Here?
Seasonality is a powerful force in Austin's inventory cycle. Historically, MOI tends to build through spring and early summer as sellers list ahead of the school-year calendar, then contracts in fall and winter. This seasonal pattern was visible in 2025, when inventory peaked in June at 6.53 before declining through the second half of the year. The same dynamic could play out again in 2026, with MOI potentially rising modestly into the summer before cooling.
The bigger question is where the floor holds. If the 2026 seasonal inventory build is modest — and active listings don't approach the June 2025 record of 18,948 — it would suggest that sellers are holding back, supply is constrained, and the market may remain in seller-to-neutral territory through the year. If listings surge again, neutral or even buyer-market conditions are possible for stretches of the summer.
What the current 4.92 reading tells us most clearly is that the Austin housing market is competitive but not frenzied. It rewards preparation, accurate pricing, and market knowledge — for buyers and sellers alike. Tracking this metric monthly is one of the most reliable ways to understand where the austin real estate market is headed, and what conditions to expect when making a transaction decision.
Frequently Asked Questions
What does months of inventory mean in real estate?
Months of inventory is a measure of how long it would take to sell all current active listings on the market at the existing pace of home sales, assuming no new properties were added. In the Austin real estate market, a reading below 5 months (147 days) indicates a seller's market, between 5 and 7 months reflects a neutral market, and above 7 months signals a buyer's market. As of March 2026, Austin sits at 4.92 months — technically still a seller's market, but within 0.08 months of the neutral threshold. This metric is one of the most direct gauges of supply and demand balance in any housing market.
Is Austin currently a buyer's or seller's market in 2026?
As of March 2026, Austin remains in seller's market territory with 4.92 months of inventory — just below the 5-month threshold that separates seller's and neutral market conditions. While sellers still hold a technical advantage, the edge is narrow. The market has pulled back significantly from the extreme seller's conditions of March 2021, when inventory hit an all-time low of 0.65 months. The current austin housing market offers buyers meaningfully more options and leverage than they had during the pandemic era, even as the balance has not yet tipped fully into neutral or buyer territory.
What was Austin's housing inventory like during the pandemic?
The pandemic period produced historic extremes in Austin's inventory data. In March 2021, the Austin area recorded 0.65 months of inventory — the lowest ever measured in this dataset and a reflection of unprecedented buyer demand colliding with extremely limited supply. By contrast, as interest rates rose sharply through 2022 and 2023, inventory climbed steeply. By June 2025, MOI had reached 6.53 months and active listings peaked at 18,948 — the highest listing count in the dataset's history. Austin's austin real estate trends between 2020 and 2025 represent one of the most dramatic inventory cycles ever recorded in the metro.
How does the current Austin inventory compare to historical averages?
The current 4.92-month reading for March 2026 falls within the range that Austin experienced throughout the pre-pandemic period from 2005 to 2019, when March readings generally ranged from about 2.44 to 6.66 months. Compared to the all-time high of 8.72 months recorded in July 2010 and the all-time low of 0.65 months in March 2021, today's austin real estate market sits closer to its long-run historical midpoint. The market appears to be normalizing after several years of extreme volatility, which is consistent with a healthy and functioning housing environment.
What happens to Austin home prices when inventory is near 5 months?
Inventory near 5 months in the Austin housing market generally corresponds to moderate price conditions — sellers retain some pricing power but cannot push values as aggressively as in sub-2-month environments. The 0.08-month gap between today's reading and neutral territory suggests that austin home prices are unlikely to see the rapid appreciation of 2021-era conditions, but also that significant downward price pressure is not the dominant risk. Markets near this equilibrium tend to see more measured, sustainable price movement — favoring transactions that are priced accurately from the start. Monitoring this metric monthly provides the clearest leading indicator for where austin real estate trends may be headed through the rest of 2026.