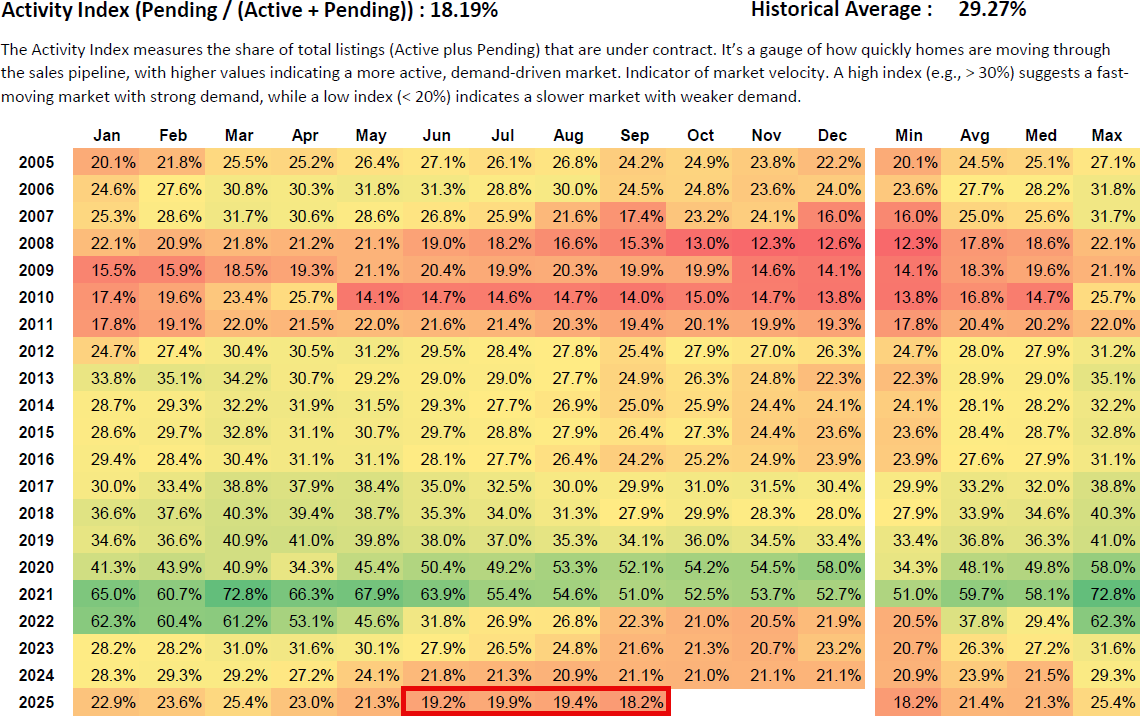
Austin’s housing market just crossed an important threshold — and there’s no easy way to say it. For the first time in over a decade, our Activity Index has stayed below 20% for four straight months, signaling a sustained slowdown in the Austin real estate market. In plain terms, this means fewer homes are going under contract compared to the number available. The pace of transactions has slowed, and buyer confidence has softened. But while this is a critical marker, it’s not a sign of panic — it’s a sign of pause.
What the Activity Index Measures
The Activity Index tracks market velocity — how quickly homes are being absorbed by demand. It’s calculated by dividing the number of pending listings by the total of active plus pending listings in a given month. Formula: Pending ÷ (Active + Pending) = Activity Index. In simple terms: “Of all the homes available, what share went under contract this month?”
This index tells us what most metrics can’t — how fast the market is moving right now. It’s a leading indicator, meaning it changes before prices or inventory levels do.
The Red Line Explained
When the Activity Index falls below 20%, we call it the Red Line. It’s the point where the balance of supply and demand tips — homes sit longer, and buyers hesitate. Here’s how we define the ranges:
Market Phase Typical Range Market Condition
Expansion 30%–45% Strong demand, rising prices
Equilibrium 25%–30% Balanced conditions, steady absorption
Softening 20%–25% Slower sales, rising inventory
Contraction / Danger Zone < 20% Market stalls, supply imbalance, price decline
Crisis / Freeze ≤ 15% Buyer paralysis, price corrections accelerate
Below 20%, the market shifts from “slower” to “stalled.”
But a stall doesn’t mean a collapse — it means we’ve hit a level of hesitation where buyers and sellers are out of sync.
What Makes 2025 Different : This is the first time since 2010 that Austin’s Activity Index has stayed below 20% for four consecutive months. That makes this slowdown significant, but it’s also very different from past downturns. In 2008, the market collapsed suddenly. Mortgage credit froze, inventory spiked, and the Activity Index plunged from 25% to 13% within months. That was panic. In 2022, the market hit a wall when interest rates doubled almost overnight. The shock caused activity to drop rapidly, but it rebounded within eight months as buyers and sellers adjusted. In 2025, the decline has been gradual — steady, not sudden. The market isn’t breaking down; it’s cooling under the weight of affordability pressures, confidence fatigue, and a slower economy.
This slowdown isn’t being driven by fear — it’s being driven by math. High interest rates, stretched affordability, and cautious consumer sentiment have created a slow-motion rebalancing. Sellers are still anchored to 2022 prices, while buyers are calculating what they can truly afford. The result: fewer contracts, longer timelines, and an Activity Index that has now settled below the Red Line.
Why It Matters
Crossing below 20% for one month might be noise — a temporary dip. But staying there for four straight months means it’s sustained. Historically, this kind of sustained stall signals that the market has reached the final stage of correction before stabilization. In both previous cycles, once the Activity Index remained under 20% for several months, it was followed by 6–12 months of bottoming and recovery. That pattern suggests that Austin’s market, while clearly slowed, is likely moving closer to its equilibrium point — not toward a free fall.
What Buyers Should Know : For buyers, a sub-20% Activity Index means one thing: time is finally on your side. Homes are staying on the market longer, negotiations have opened up again, and there’s more room to make thoughtful offers without competing against multiple bids. However, this window won’t last forever. When affordability improves or rates ease, demand tends to surge back quickly — especially in markets like Austin with long-term job and population growth drivers. Buyers who wait for the “bottom” rarely catch it. Those who prepare, stay informed, and buy strategically in a slower market often benefit most once momentum returns.
What Sellers Should Know : For sellers, crossing the Red Line is a reminder that pricing and presentation matter more than ever. In this kind of market, homes that are priced right and move-in ready still sell — but overpricing guarantees extended days on market and price reductions later. Buyers aren’t disappearing; they’re discerning. They’re comparing your property against every other available listing — and they have choices. Sellers who adjust early tend to win. Those who chase the market down tend to lose both time and money.
What Investors Should Watch : Investors should view this phase as the setup for opportunity. When activity is low but supply is stable, that’s the early stage of a recovery environment. Cap rates and cash flow potential start to improve before price momentum returns. This is when disciplined investors quietly position themselves — analyzing rents, cash flow, and inventory depth — preparing to move as soon as confidence turns. Every major Austin recovery over the past two decades began within six to twelve months of this kind of sustained slowdown.
What Happens Next : If history is a guide, the market will likely remain in this low-velocity phase through early to mid-2026. We’ll see small adjustments in pricing, a gradual leveling in inventory, and eventually, as confidence returns, the Activity Index will begin climbing back above 20%.
In other words — we’re closer to the bottom than the top. This is when the market rewards clarity, not noise. Buyers who are prepared, sellers who adapt, and investors who stay data-driven will be the first to benefit when the next cycle begins.
Closing Thoughts : Crossing the Red Line is a milestone, not a meltdown. It’s a reminder that housing markets move in cycles — and every slowdown creates the foundation for the next period of growth. At Team Price Real Estate, we track the Activity Index daily because it tells the truth before the headlines do.
It’s not speculation — it’s the data that drives our understanding of the Austin housing market. For now, the story is simple: The market has slowed. Confidence has cooled. But stability is building. This is the pause before the pivot.
FAQ
What is the Activity Index?
The Activity Index measures how many homes go under contract compared to how many are for sale. It’s the clearest gauge of how fast the market is moving and is considered a leading indicator for Austin real estate trends.
Why is 20% considered the Red Line?
Historically, once the share of pending homes drops below 20%, the market experiences a clear stall in momentum. Below this level, prices and sales volume flatten until confidence returns.
How long do markets stay below the Red Line?
In past cycles, the stall phase typically lasted 6 to 12 months before stabilization began. Once activity starts rising again, price recovery usually follows within a year.
Is this 2008 all over again?
No. The 2008 crash was caused by credit collapse and over-leverage. The 2025 slowdown is a confidence and affordability correction — slower, more orderly, and financially healthier.
What should I do if I’m planning to buy or sell?
Buyers should take advantage of leverage and choice; sellers should focus on pricing and presentation. Both should stay informed and move strategically rather than react emotionally.