Austin Housing Affordability Returns to 2015 Levels as Price-to-Income Ratio Falls to 3.89
Published | Posted by Dan Price
Austin Housing Affordability: November 2025 Price-to-Income Ratio Marks the Lowest November Since 2019
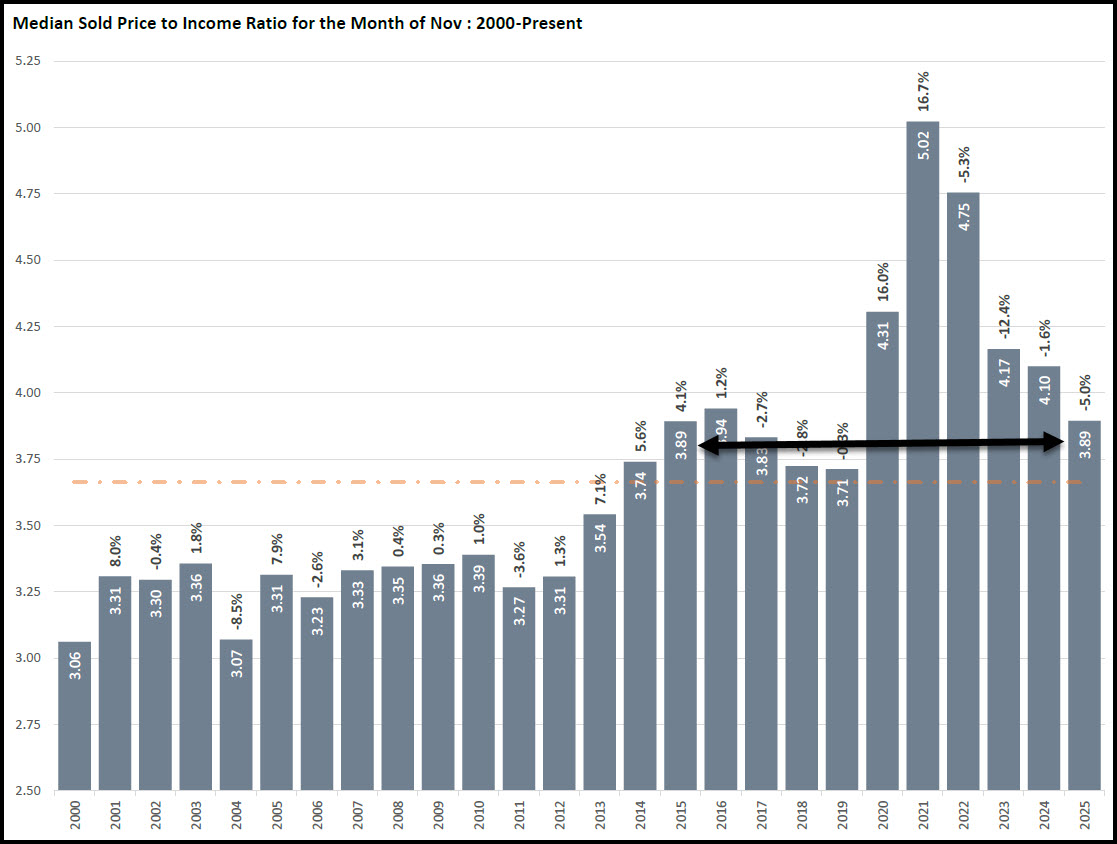
The Austin real estate market took another meaningful step toward long-term affordability this November. The Median Sold Price to Household Income Ratio landed at 3.89, a level not seen in a November reading since 2019 and identical to November 2015. That alignment matters. It signals a full reset of the affordability gains lost during the 2020–2022 surge and places Austin’s housing market much closer to its long-term historical balance. In an environment where buyers, sellers, and agents are searching for clear direction, the price-to-income ratio remains one of the most important indicators of market stability and long-term sustainability.
The Austin housing market has been through a dramatic cycle, with rapid price appreciation followed by a slow, methodical correction. The data shows the ratio rising from the low threes in the early 2000s to the mid threes leading into 2020, then spiking above five during the peak of the pandemic boom. The highest November on record hit 5.12 in 2021, a level completely detached from local wage growth and far outside the city’s long-run norm. That period marked the point where Austin home prices became fundamentally misaligned with household incomes. Today’s reading of 3.89 shows that the market has retraced most of that excess, settling only slightly above the historical average of 3.66.
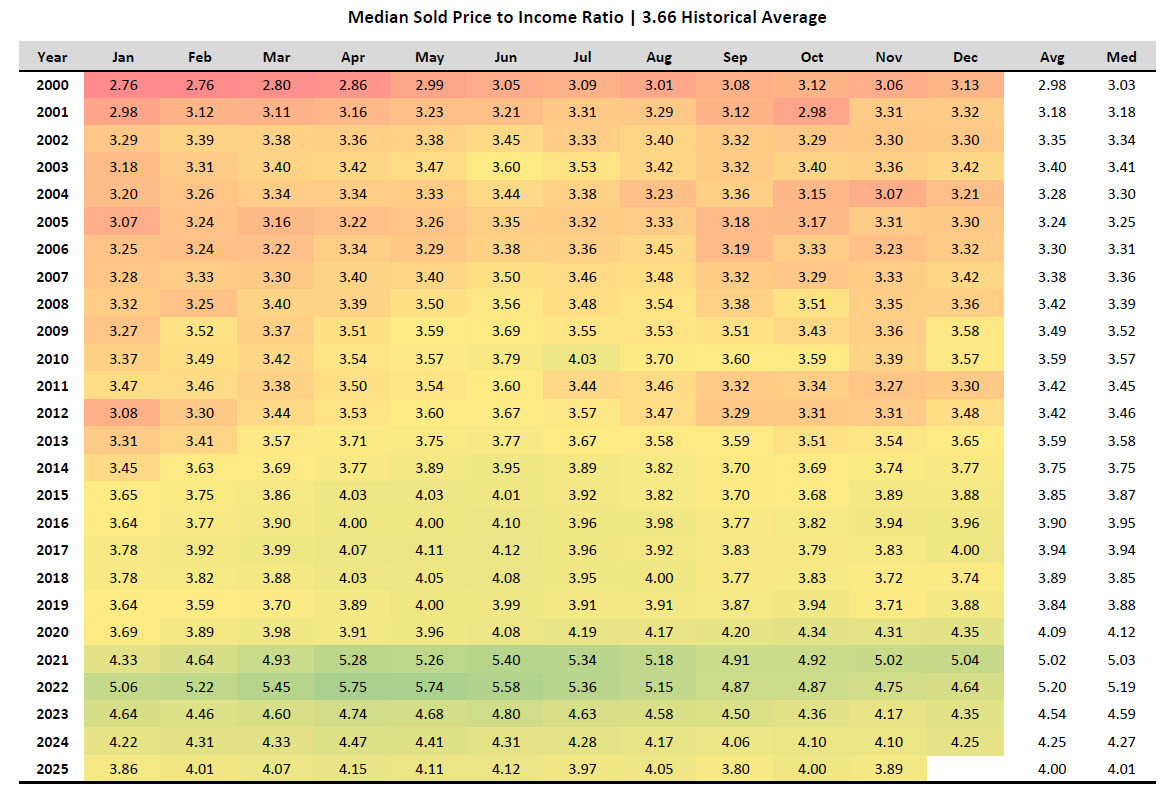
Looking back over the data, the path of affordability is clear. The ratio remained stable for nearly two decades, hovering around 3.0 to 3.5 through the early 2000s and gradually rising to the mid threes by the mid-2010s. Even during the run-up in 2017 through 2019, the ratio stayed between 3.71 and 3.83 in November. That period represented Austin’s pre-pandemic equilibrium, where price growth generally tracked income growth and maintained functional affordability for most buyers. The November 2025 reading of 3.89 is slightly above those years but close enough to reflect the same level of structural balance the city experienced prior to the boom.
The real break in the data appears in 2020 and 2021. Pandemic-driven migration, low interest rates, limited resale inventory, and an aggressive new-construction cycle forced a sharp acceleration in prices. As a result, the November ratio rose to 4.34 in 2020, then surged to 5.12 in 2021, the highest level in the entire 25-year dataset. From a long-term valuation standpoint, that spike pushed Austin home prices well above what local incomes could reasonably support. The 2022 and 2023 readings, at 5.04 and 4.62, show the ratio beginning to fall from its peak, but still far above historical norms. Only in the 2024 and 2025 readings do we finally see the structural correction take hold, bringing the city back into a sustainable affordability range.
The significance of the current 3.89 ratio becomes clearer when compared against both the historical average and the surrounding years. The long-term mean of 3.66 serves as the reference point for a balanced Austin property market. November 2025 now sits just 6 percent above that figure, confirming that affordability has improved meaningfully without requiring a severe market disruption. Contrast that with the November 2021 peak, which was 40 percent above the historical average. The data shows how far the market has traveled from the extremes of the pandemic cycle and how close it is to long-run stability.
Another important detail comes from comparing the current reading with the earlier years in the dataset. In the early 2000s, the ratio consistently fell between 2.8 and 3.3 in November. Those years represented a period when Austin’s median household income growth kept pace with home prices and allowed the city to remain one of the most affordable major tech markets in the country. By 2010, the ratio had climbed into the mid threes, with November 2010 recording a value of 3.59. That range persisted throughout the decade, establishing the city’s affordability baseline prior to the disruptive pandemic spike. November 2025’s 3.89 sits slightly above that decade’s norm but close enough to confirm that Austin has returned to a fundamentally healthy price-to-income structure.
One of the clearest insights in the data is the relationship between affordability cycles and broader Austin real estate market trends. The low ratios of the early 2000s aligned with a period of strong population growth, rising job creation, and robust new development. As the city evolved, home prices gradually increased, but household incomes tracked closely enough to maintain equilibrium. The sharp divergence that occurred during the pandemic years was unsustainable and directly contributed to the elevated inventory, price reductions, and slower market velocity seen over the last two years. The affordability correction was not optional; it was necessary to restore balance across the Austin housing market.
The return to a sub-four ratio reveals how much progress has been made. Buyers entering the Austin property market today face a landscape far more favorable than what existed during the peak surge. While mortgage rates remain a challenge, the underlying price structure has shifted much closer to long-term fundamentals. Sellers must navigate a more price-sensitive environment, but they benefit from operating within a market that is stabilizing rather than deteriorating. Agents have clearer data signals, which support more accurate pricing strategies, stronger buyer guidance, and more realistic seller expectations.
November 2025’s ratio matching November 2015 is more than just a statistical coincidence. It marks a full decade of movement that has ultimately come full circle. Austin home prices have undergone a dramatic expansion and contraction, but the city has returned to an affordability level consistent with a sustainable and healthy housing ecosystem. The resemblance to 2015 underscores how cyclical the Austin real estate market can be and how essential it is to rely on long-term data when evaluating current conditions.
As the Austin housing market continues moving into 2026, the price-to-income ratio will remain a key indicator of whether affordability holds its current position or continues to improve. Inventory levels, new listing volume, pending demand, and price reductions will all contribute to near-term movement, but the broader trend suggests the market is nearing a long-term floor. Whether the ratio dips below the 3.8 range in the coming months will depend on the balance between income growth and continued pricing adjustments. For now, the evidence supports the view that Austin home prices have realigned with incomes in a way that strengthens market stability and improves access for a broader range of buyers.
The affordability reset captured in November 2025’s 3.89 reading reflects a historic correction across the Austin property market. Years of accelerated appreciation have unwound, and the city is once again approaching the level of accessibility that defined much of the 2010s. The data confirms that Austin real estate is moving toward a more rational and predictable pattern, aligning construction, wages, and long-term demand. For buyers, this represents a healthier entry point. For sellers, it reinforces the importance of accurate pricing. For the overall Austin housing economy, it signals progress toward balance after a turbulent cycle.
FAQ What does a 3.89 price-to-income ratio mean for the Austin real estate market?
A ratio of 3.89 means the median home price in Austin is 3.89 times the median household income. This places affordability near long-term historical levels and far below the peak values seen in 2021 and 2022. It signals that Austin home prices have corrected back toward income alignment, reducing the structural pressure that defined the market during the boom years and improving sustainability across the Austin housing economy.
Is Austin more affordable today compared to the past few years?
Yes. Austin housing affordability has significantly improved. The price-to-income ratio peaked at 5.12 in 2021 and remained above five in 2022. By November 2025, the ratio fell to 3.89, making it the lowest November reading since 2019. This improvement reflects a multi-year correction in home prices rather than a surge in local wages.
How does current affordability compare to Austin’s historical average?
The long-term historical average ratio is 3.66, meaning November 2025 is only about 6 percent above typical affordability conditions. This places the market close to its long-run equilibrium and well within sustainable range compared to the extreme imbalance of the pandemic cycle. It also shows that Austin home prices have returned to levels consistent with normal income growth patterns.
What caused affordability to return to these levels?
Affordability improved due to price correction rather than income expansion. Elevated inventory, longer days on market, substantial price drops from the 2021–2022 peak, and increased negotiating leverage all contributed to the shift. These factors collectively reduced the median sold price enough to bring the price-to-income ratio back toward its historical balance.
What does this affordability trend mean for 2026?
If Austin home prices continue adjusting while income stabilizes, the ratio could move even closer to the long-term mean in early 2026. A further decline would depend on inventory levels, rate movement, builder incentives, and seasonal demand. The current trajectory suggests a stable Austin housing environment with affordability that resembles pre-pandemic conditions and supports more predictable market behavior.