Exploring Housing Affordability in Austin Through the Numbers
Housing affordability in Austin has been a hot topic for years, and the latest data from Team Price Real Estate’s affordability report, dated March 19, 2025, gives us a clear look at how monthly mortgage payments have evolved and what they mean for residents today. This report dives deep into the numbers, tracking the monthly mortgage payment—known as PITI, which stands for Principal, Interest, Taxes, and Insurance—over 25 years. It uses the median sold price each month, assumes a 20% down payment, and applies the 30-year mortgage rate at that time. Let’s walk through what this data reveals about Austin’s housing market, from historical trends to current costs across the city’s zip codes.
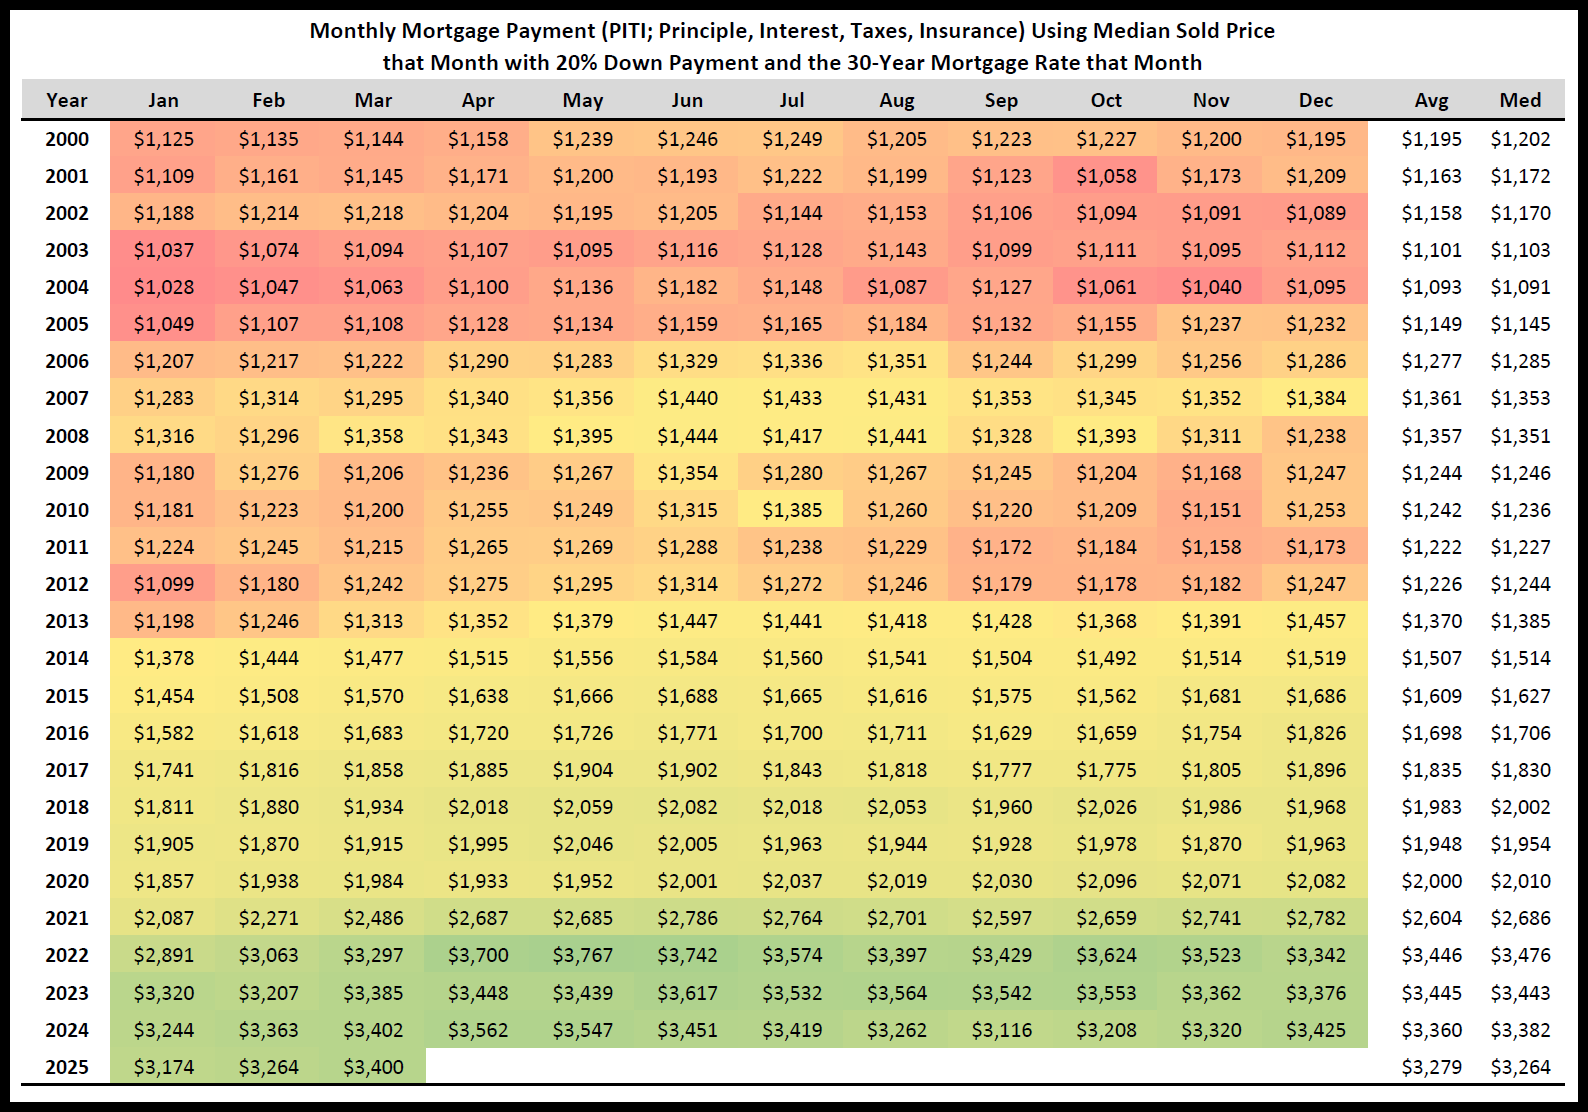
Back in 2000, the average monthly PITI was $1,195, a figure that stayed relatively steady through the early 2000s. For example, in 2001, it averaged $1,163, and by 2003, it dipped to $1,101. Things started shifting after the 2008 financial crisis, with 2009 showing a modest drop to $1,244 as home prices and interest rates adjusted. The 2010s marked a slow climb, with payments holding at $1,242 in 2010 and reaching $1,912 by 2019. Then came the 2020s, and the numbers took off. In 2021, the average jumped to $2,564, and by 2022, it hit $3,542—a peak driven by soaring home prices and rising rates. The report shows some leveling off in 2023 and 2024, both averaging $3,612, before settling at $3,400 in March 2025. That’s nearly triple the cost from 2000, showing how much tougher it’s gotten to buy a home in Austin over time.
Looking at year-over-year changes, the data highlights some big swings. In 2022, the largest annual increase was $1,083 in May, with an average rise of $842 across the year. That translates to a peak percentage jump of 40.3%, a massive shift from the year before. Compare that to 2009, when payments dropped by as much as $189 in October, totaling a $1,352 decline for the year—a 13.8% decrease tied to the recession. More recently, the first three months of 2025 show smaller changes: a $70 drop in January, $99 less in February, and a $2 dip in March, adding up to a $171 decrease so far. These numbers suggest the market might be stabilizing after years of rapid growth, though it’s still far from the affordability of decades past.
Month-to-month shifts offer another layer of detail. The biggest single-month increase was $403 in April 2022, a 12.2% jump, while the largest drop was $251 in January 2025, down 9.0%. In 2025 alone, January fell by $251, February rose by $90, and March climbed $136—a 4.2% uptick. Over the years, April often sees gains, like $200 in 2021, while January and September tend to show declines. These fluctuations reflect seasonal patterns and sensitivity to interest rate changes, giving a sense of how unpredictable monthly costs can be for Austin homebuyers.
The report also breaks down affordability across 75 zip codes in the Austin area, measuring how much of a household’s income goes to PITI with a 20% down payment. Out of these, only two zip codes are considered affordable, meaning PITI takes up 35% or less of median income. Twenty-four fall into the moderately affordable range, between 35% and 50%, while 49 are unaffordable, exceeding 50%. In Jarrell (zip code 76537), the median income is $83,401, and PITI is $2,349, using 33.8% of income—making it one of the most affordable spots.
Elgin (78621) follows, with $85,262 in income and $2,514 in PITI, at 35.4%. On the other end, Florence (76527) has a median income of $65,245 but a PITI of $6,005, eating up 110.4% of income. In Austin’s 78746 zip code, where income is $179,148, PITI reaches $18,378—123.2% of income, far beyond what most can manage. The report calculates that 78746 residents would need $630,013 in income to keep PITI at 35%, showing a huge gap.
Down payment size changes the picture too. The report compares PITI across five scenarios: 20% down with no private mortgage insurance (PMI), 15% with 0.23% PMI, 10% with 0.46% PMI, 5% with 0.59% PMI, and FHA’s 3.5% with 0.55% mortgage insurance premium (MIP). For a $760,000 home in 78701, PITI is $5,652 with 20% down, but it jumps to $6,475 with 5% down—a 14.6% increase. In Driftwood (78619), with a $1,299,900 median price, it’s $9,401 at 20% and $10,809 at 5%, adding $1,408 monthly. Across Austin’s average of $625,000, PITI ranges from $4,649 to $5,327 depending on the down payment. Smaller down payments mean higher costs, especially for buyers with less cash upfront.
Mortgage insurance plays a big role in these numbers. For conventional loans with less than 20% down, PMI ranges from 0.19% to 1.86% of the loan amount annually, depending on credit score and loan-to-value ratio. For a $200,000 loan at 1.0%, that’s $2,000 a year, or $166 monthly. FHA loans, with 3.5% down, charge 1.75% upfront and 0.55% annually—down from 0.85% before March 2023. On a $300,000 home with 3.5% down, FHA’s monthly cost is $208, compared to $292 for a conventional loan. The report shows how these extras protect lenders, not borrowers, and add up quickly for those stretching to buy.
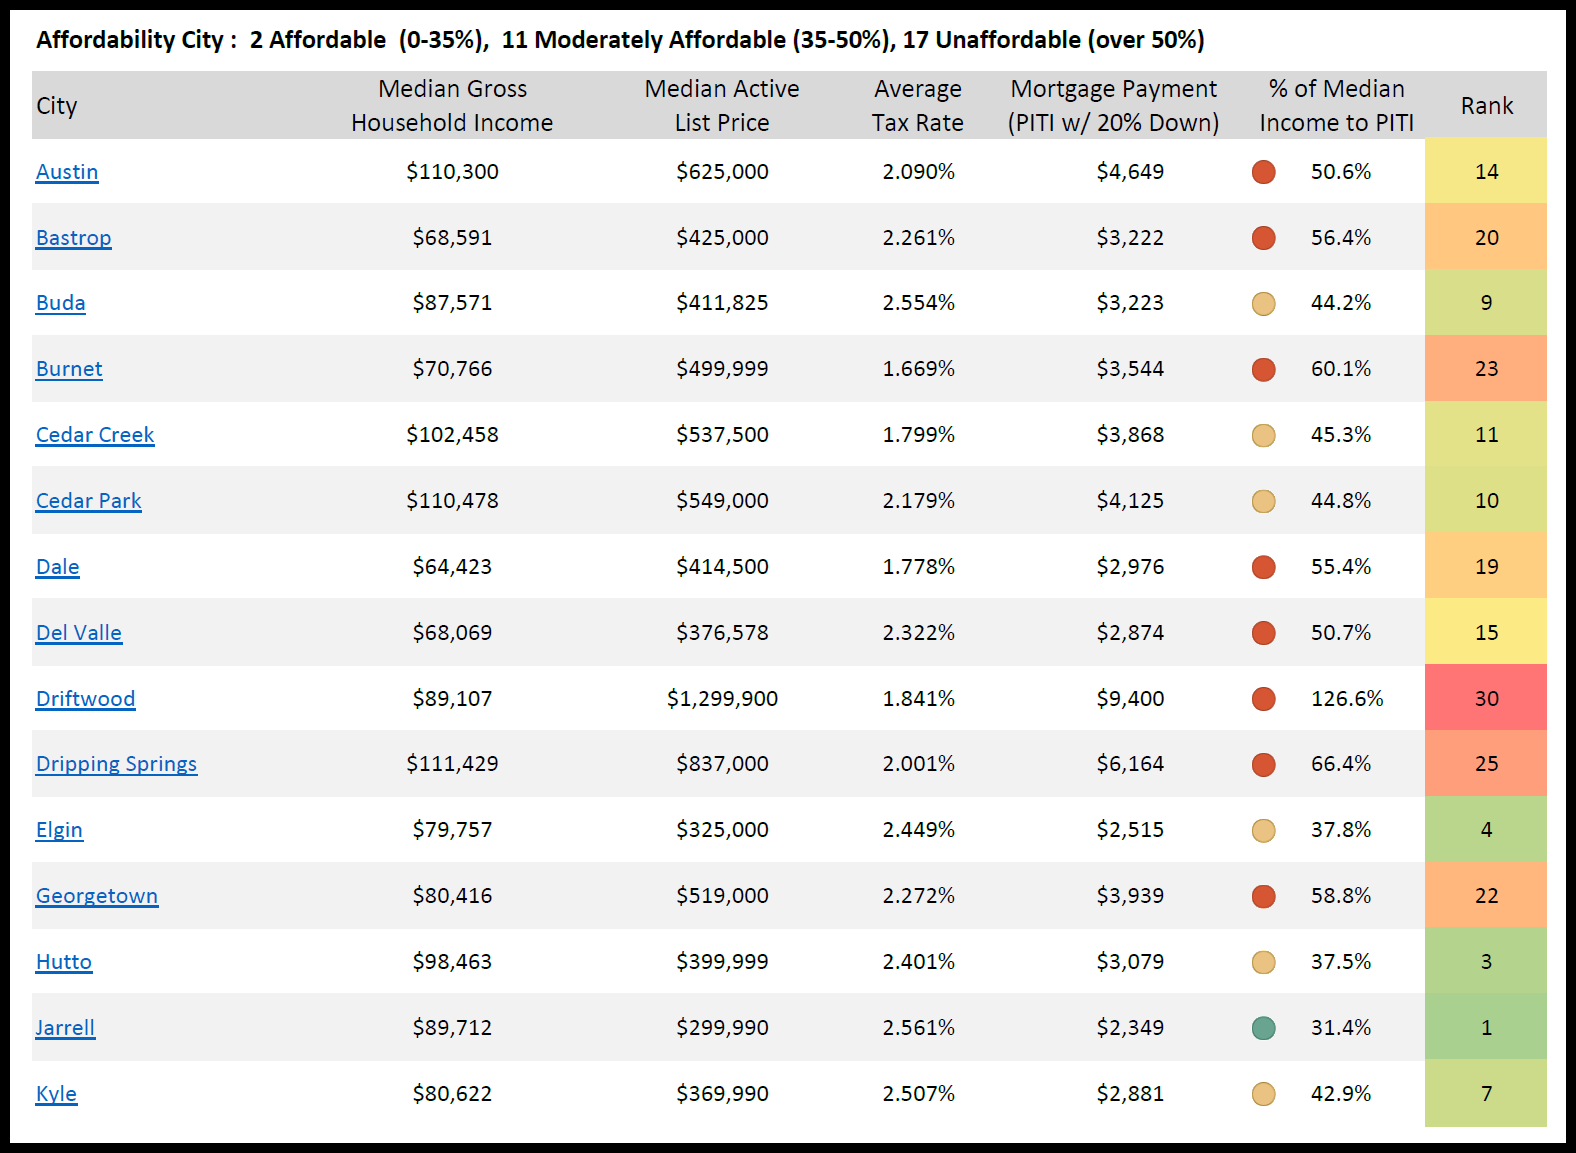
Across cities, the data varies widely. Austin’s median price of $625,000 yields a PITI of $4,649 with 20% down, while Buda’s $411,825 home costs $3,223. Driftwood’s $1,299,900 price tag means $9,400 monthly, and Jarrell’s $299,990 keeps it at $2,349. These figures show how location and price shape affordability, with rural areas like Jarrell offering lower costs than central Austin or upscale Driftwood. The report’s zip code details—like $3,483 in Pflugerville (78660) versus $9,401 in Driftwood (78619)—highlight the range of experiences within the metro area.
This affordability report, last revised on March 19, 2025, pulls together decades of data to show how Austin’s housing market has changed. From a modest $1,195 monthly payment in 2000 to $3,400 today, the numbers tell a story of rising costs and shrinking accessibility. Whether it’s the year-over-year surges of 2022, the monthly ups and downs of 2025, or the stark differences across zip codes, the data offers a detailed snapshot of what it takes to buy a home in Austin right now.
Q1: How much does the average mortgage cost in Austin in 2025?
A: According to Team Price Real Estate’s March 19, 2025, report, the average monthly mortgage payment (PITI) in Austin with a 20% down payment is $4,649 for a median-priced home of $625,000. This varies by area, with Jarrell at $2,349 for a $299,990 home and Driftwood at $9,400 for a $1,299,900 home.
Q2: Is housing in Austin affordable in 2025?
A: The 2025 affordability report shows that only 2 of 75 zip codes in the Austin area are affordable, where PITI is 35% or less of median income. Twenty-four are moderately affordable (35-50%), and 49 are unaffordable (over 50%). For example, in 78746, PITI takes up 123.2% of income, while Jarrell stays at 33.8%.
Q3: How have Austin home prices changed over time?
The report tracks PITI from $1,195 in 2000 to $3,400 in March 2025, nearly tripling over 25 years. Home prices and mortgage rates drove big jumps, like $1,083 year-over-year in 2022, though 2023 and 2024 stabilized around $3,612, reflecting a mix of price growth and rate shifts.