Austin Housing : Absorption Has Slipped to 16.02%, About Half the Long-Run Average
Austin’s sold-to-active ratio, also called the absorption rate, is 16.02%—roughly fifty percent of its long-term average of 31.88%—signaling a slower, buyer-leaning market where a smaller share of listed homes is converting to sales each month.
Market overview and why absorption matters
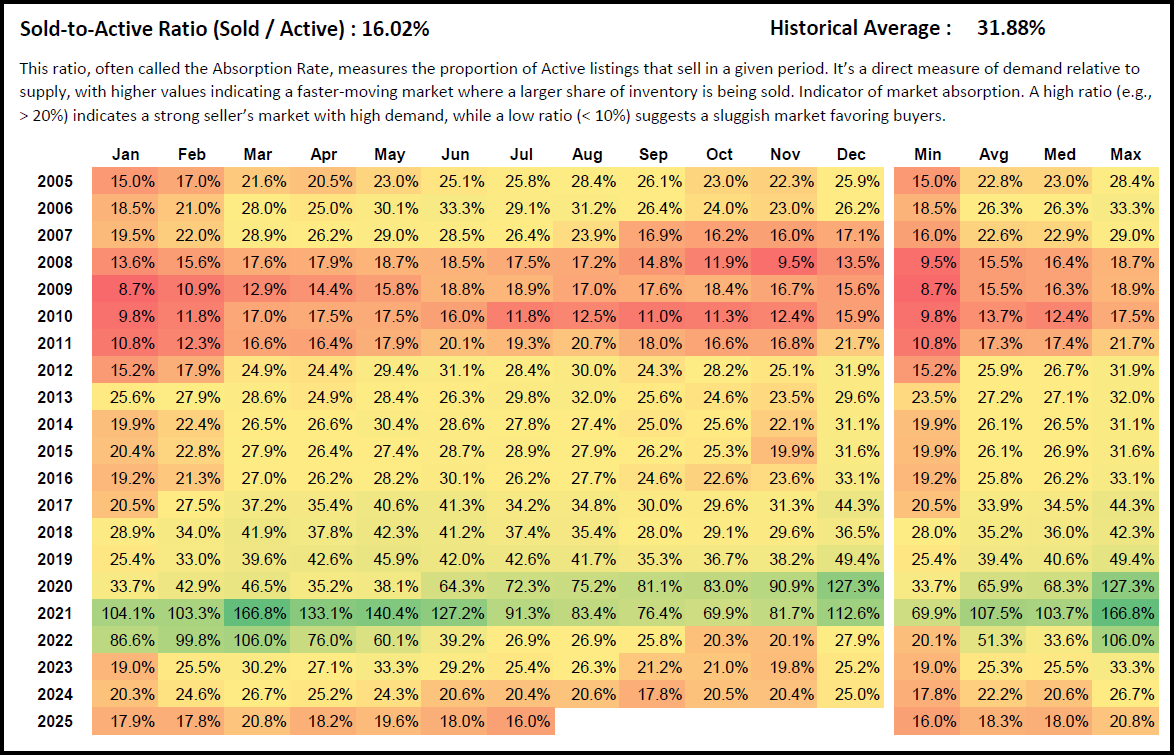
The sold-to-active ratio measures how many homes sell compared with how many are available. Higher percentages indicate stronger demand relative to supply. In Austin real estate, readings above twenty percent historically align with a firm seller’s market, while sub-ten percent indicates a very soft market favoring buyers. At 16.02%, Austin sits between those poles, but the direction of travel matters. The ratio has been trending lower through 2025, and the year-to-date average of 18.3% is well under the historical average of 31.88%, running about 42.6% lower. In practical terms, fewer new listings are being absorbed each month, competition among sellers is increasing, and buyers have more time and leverage to negotiate.
2025 trend: a weaker spring, soft summer
Seasonally, Austin’s absorption usually lifts in spring and cools in late summer and fall. We saw the lift this March, but it was muted. Monthly readings for 2025 came in at 17.9% in January, 17.8% in February, a spring high of 20.8% in March, then 18.2% in April, 19.6% in May, 18.0% in June, and 16.0% in July. The March peak barely cleared the twenty-percent bar that typically marks a healthier seller-leaning market, and by July the ratio had fallen to the year’s low. The year-to-date range—sixteen to twenty-one percent—keeps the market decisively below the conditions that drove bidding intensity in prior cycles.
Year-over-year comparisons confirm the slowdown
Every month of 2025 has tracked below 2024. January fell from 20.3% to 17.9% (down 11.8%). February dropped from 24.6% to 17.8% (down 27.6%). March slid from 26.7% to 20.8% (down 22.1%). April eased from 25.2% to 18.2% (down 27.8%). May moved from 24.3% to 19.6% (down 19.3%). June stepped down from 20.6% to 18.0% (down 12.6%). July declined from 20.4% to 16.0% (down 21.6%). The 2025 average of 18.3% compares with 22.2% in 2024 and 25.3% in 2023, marking a three-year slide that keeps the Austin real estate market closer to buyer-friendly than seller-friendly conditions.
Historical context: from boom to normalization to undershoot
The longer record frames today’s reading. From 2005 to 2011, Austin’s absorption mostly ranged in the teens and low twenties, with cyclical lows under ten percent in 2008–2010. Beginning in 2012, the ratio moved sustainably higher into the mid-twenties to forties, peaking in 2017–2019 with multiple months above forty percent and a 2019 high of 49.4% in December. The pandemic shock then drove unprecedented absorption: 2020 averaged 65.9% and 2021 averaged 107.5%, with several months in triple digits as listings sold faster than new supply arrived. The market then rebalanced. In 2022, the yearly average fell to 51.3% as borrowing costs reset and demand cooled. By 2023 the average normalized further to 25.3%, and 2024 ticked down again to 22.2%. The 2025 year-to-date average of 18.3% now sits not only below the historical average, but also closer to the mid-2000s and early-2010s levels that characterized slower turnover.
Peak-to-present perspective
Comparing the current landscape to the pandemic peak underscores the shift. The 2025 year-to-date average of 18.3% is roughly seventeen percent of 2021’s 107.5% average. Even relative to the long-run average of 31.88%, today’s 16.02% current reading is lower by 15.86 percentage points. The market has not seized up—Austin is still transacting—but absorption is clearly sub-par versus typical years, and materially weaker than 2023–2024.
Seasonal signals and near-term austin housing forecast
Seasonality still matters for the Austin property market. In most years the sold-to-active ratio tops out between March and June. In 2025, March was the high at 20.8% and each subsequent month softened, culminating at 16.0% in July. Without a demand catalyst or meaningful reduction in active inventory, late-summer and early-fall readings are more likely to hover in the mid-teens than to break above the mid-twenties. For the austin housing forecast to strengthen into a seller-tilted regime, the ratio would need to re-establish a base above twenty percent for several consecutive months and show a clear trend toward the mid-twenties.
What the absorption rate implies for buyers
For buyers tracking the austin real estate market, a mid-teens absorption rate means a slower pace and more optionality. Lower absorption reduces the frequency of multiple-offer situations and extends decision windows. Negotiation power subtly tilts toward buyers when demand under-absorbs available supply. As listings take longer to convert, concessions and price flexibility tend to increase, particularly on homes that miss the first two weeks of showings. This does not mean prices must fall across the board; it means the path of least resistance favors patient, data-driven buyers who target mispriced or aging inventory.
What the ratio means for sellers and pricing strategy
For sellers, the current austin real estate forecast requires disciplined pricing and preparation. When only about sixteen to twenty percent of active listings are selling in a given month, the market quickly punishes over-pricing and incomplete presentation. The strategy that works best in this environment is front-loaded: price to the most recent comps and trajectory, stage and photograph professionally, and pre-empt buyer objections with repairs and disclosures. Listings that achieve strong traffic in week one still clear efficiently, but the margin of error is narrower than in 2021–2022. Sellers who miss the initial window often have to chase the market down with price reductions to re-capture demand.
Investor read on the austin property market
Investors care about absorption because it aligns with liquidity and rent-to-sell decision timing. The 2025 pattern suggests the Austin housing market is in a price-discovery phase whenever listings are mis-positioned; properties that are clean, well-located, and priced to today’s comps still clear, but underwriting needs to assume longer marketing periods and more conservative exit spreads. The silver lining for investors and owner-occupants alike is selection. A slower sold-to-active ratio expands the set of viable options and increases the probability of negotiating favorable terms.
How 2025 compares with prior troughs
It is useful to separate today from the great-recession lows. In 2008–2010, multiple months printed below twelve percent and the yearly mins hit 9.5%, 8.7%, and 9.8%. The 2025 minimum so far is 16.0%. That is weaker than 2023’s 19.0% and 2024’s 17.8%, but still well above the single-digit extremes that marked the prior downturn. Austin remains active; it is simply operating at a lower gear than its historical norm.
Bottom line for the Austin housing forecast
The current sold-to-active ratio of 16.02% places Austin clearly below its 31.88% historical average and below the last two years. The 2025 year-to-date average of 18.3%, with a March high of 20.8% and a July low of 16.0%, confirms a soft, buyer-tilted summer. Unless the ratio sustains a move back above twenty percent into the fall, the austin real estate market will remain slower than average, favoring well-priced listings and patient buyers. Monitoring monthly absorption through the rest of the year will provide the cleanest read on whether the market is stabilizing or still easing.
FAQ: Austin real estate absorption and today’s market
What is the sold-to-active ratio and why is it important in the Austin real estate market?
The sold-to-active ratio, or absorption rate, divides monthly sales by active listings to show how quickly inventory is being purchased. In Austin housing, higher readings indicate stronger demand relative to supply. At 16.02% today, the market is selling a smaller share of listings each month than usual, which affects pricing power, negotiation leverage, and time on market.
Is Austin currently a buyer’s market or a seller’s market?
Austin is not in an extreme buyer’s market, but the mid-teens absorption rate leans toward buyers. The historical average is 31.88%, and 2025’s year-to-date average is 18.3%, both well below the seller-friendly band above twenty percent. In this environment buyers gain choices and time, while sellers must price to the market to secure early offers.
How does 2025 compare with last year’s austin housing market update?
Every month in 2025 has underperformed the same month in 2024. March fell from 26.7% to 20.8%, April from 25.2% to 18.2%, and July from 20.4% to 16.0%. The full-year averages tell the same story: 25.3% in 2023, 22.2% in 2024, and 18.3% so far in 2025, a clear three-year glide lower.
What absorption rate would indicate a healthier austin real estate forecast for sellers?
A sustained move above twenty percent would indicate firmer conditions, and the mid-twenties would resemble the stronger pre-pandemic years. The 2025 spring high of 20.8% briefly crossed that threshold but did not stick. For a durable shift, look for several consecutive months at or above the low-to-mid-twenties with improving month-over-month momentum.
How do today’s conditions compare to the pandemic boom?
They are dramatically different. The 2021 average absorption was 107.5%, with multiple months above seventy-five percent, as listings were snapped up faster than they hit the market. The 2025 year-to-date average of 18.3% is roughly seventeen percent of that peak, reflecting a normalized, slower austin property market where fundamentals and pricing discipline matter far more.