Austin Real Estate Market Report
More Austin Zip Codes Are in a Buyers Market Than Any Other Category
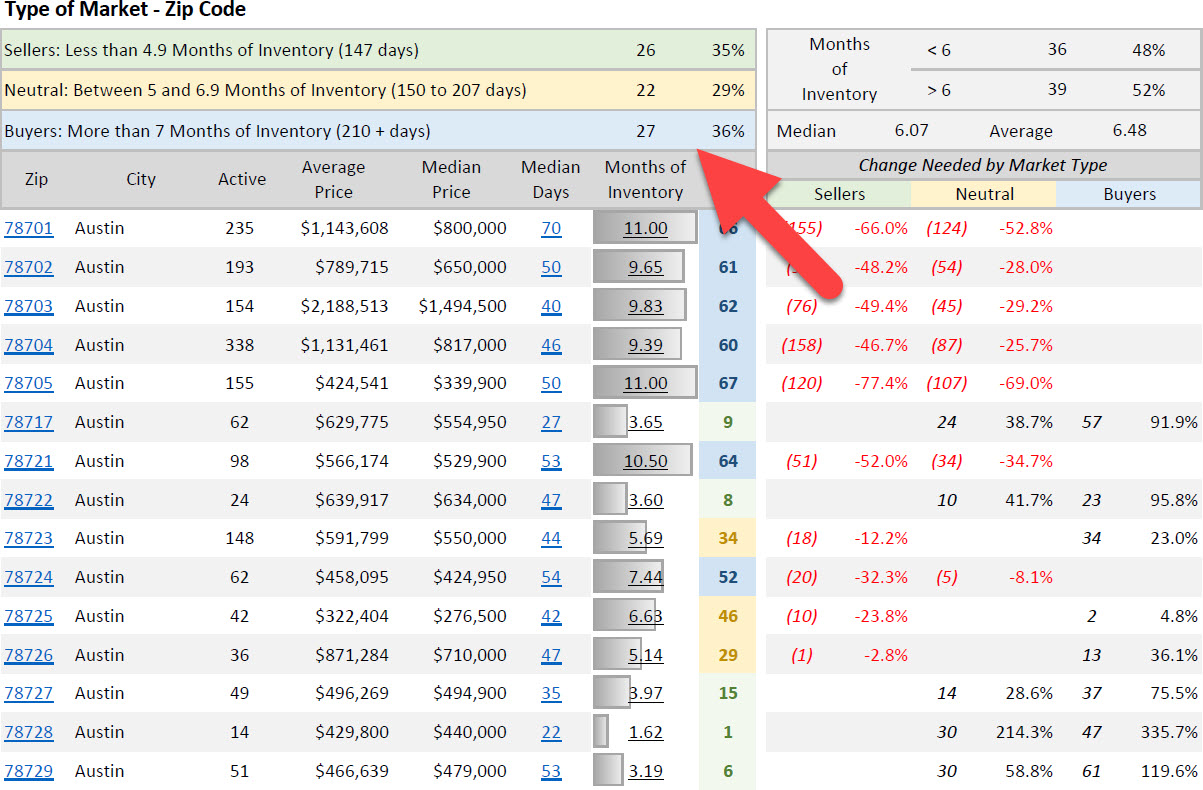
For the first time in years, buyers shopping the Austin real estate market have a structural advantage in more zip codes than sellers do. Data as of March 27, 2026, covering 75 zip codes across Central Texas, shows that 27 zip codes — 36% of the total — now qualify as buyers markets, defined as more than 7 months of inventory. That edges out the 26 zip codes, or 35%, sitting in sellers market territory with less than 4.9 months of supply. Another 22 zip codes, or 29%, fall in the neutral range between 5 and 6.9 months. The shift is significant: in 2022, sellers controlled virtually every corner of the Austin housing market. That reality no longer holds.
What the Numbers Mean
Months of inventory measures how long it would take to sell all current active listings at the current pace of sales. The real estate industry generally treats less than 6 months as a sellers market, 6 months as balanced, and more than 6 months as a buyers market. By that standard, the Austin market as a whole is leaning buyer: the median months of inventory across all 75 zip codes is 6.07, and the average is 6.48. Fifty-two percent of zip codes sit above 6 months of inventory, compared to 48% below. The market is not dramatically tilted in either direction at the macro level, but the distribution of extremes tells a more pointed story.
The most oversupplied zip codes in the Austin area are carrying 11 full months of inventory — the dataset's ceiling — including 78701 (Downtown Austin), 78705 (University of Texas area), 78741 (East Austin/South), Lago Vista, Spicewood, Driftwood, Smithville, Burnet, Marble Falls, and Dale. A seller in any of these zip codes today would need to reduce active listings by roughly 50% to 77% just to reach sellers market conditions. That is not a modest adjustment — it is a complete repositioning of supply.
The Tightest Markets Are Concentrated in the Suburbs
While buyers markets dominate the headlines, sellers still hold real leverage in a meaningful slice of the Austin property market. The tightest zip codes are almost entirely concentrated in the suburban ring north and northwest of Austin. Zip code 78728 carries just 1.62 months of inventory, the lowest in the entire dataset. Close behind are 78739 at 1.91 months, 78749 at 2.43 months, and 78750 at 2.66 months. These are move-in-ready suburban neighborhoods where demand consistently outpaces supply. Manchaca (78652) at 3.68 months rounds out the tightest markets outside the city core, and Cedar Park (78613) at 3.87 months is among the most competitive larger markets in the dataset.
The common thread across these sellers markets is price point and suburban character. Zip codes like 78728, 78739, 78749, and 78717 all carry median prices in the $440,000 to $555,000 range — accessible by Austin standards — with relatively low active listing counts and fast median days on market. Buyers competing in these areas are operating in a fundamentally different environment than buyers looking in Downtown Austin or the Hill Country communities where supply is abundant.
Downtown and Inner Austin Are Deep in Buyers Market Territory
Some of the most recognizable Austin zip codes are also the most oversupplied. Downtown Austin (78701) has 235 active listings and 11 months of inventory, with a median price of $800,000. South Congress and Bouldin Creek (78704) carries 338 active listings and 9.39 months of supply at a median of $817,000. Hyde Park and Rosedale (78703), one of Austin's most prestigious inner-city corridors, sits at 9.83 months of inventory with a median price of $1,494,500 and an average of $2,188,513. These are not distressed or overlooked zip codes — they are some of the most desirable addresses in the city — but at current price points and interest rate levels, buyer demand has not kept pace with available supply.
The Lake Travis corridor tells a similar story at even higher price points. Spicewood (78669) carries 11 months of inventory across 256 active listings with an average list price of $1,476,291. Wimberley (78676) sits at 10.71 months with a median of $675,000. Lago Vista (78645) has 327 active listings and 11 months of inventory. In these markets, sellers who need to move need to price aggressively. The data shows that to bring Lago Vista to a sellers market, active listings would need to fall by 190 units — a 58.1% reduction from current levels.
Price Pressure Is Visible Across the MLS
The market type breakdown is reinforced by the price action data across all 14,881 active listings. Nearly half — 46.56%, or 6,929 listings — have already had a price reduction, with an average cut of $58,000, representing a 7.04% reduction from the original list price. Just 2.46% of listings, or 366 homes, have seen a price increase. The remaining 50.47% have held their original price. Those numbers reflect a market where sellers are testing price points and adjusting, not one where demand is absorbing supply at asking. When nearly half of all active listings have taken a cut averaging $58,000, the pricing environment is clearly tilted toward buyers with patience.
A Market Defined by Location, Not Blanket Conditions
The most important takeaway from this data is that the Austin real estate market in March 2026 cannot be described with a single label. Buyers have the upper hand in 36% of zip codes, sellers in 35%, and 29% are genuinely balanced. The median inventory figure of 6.07 months confirms that the overall market sits near the neutral line, but that headline number masks wide dispersion. A buyer looking in 78728 faces a 1.62-month inventory environment with real competition. A buyer looking in 78701 has 11 months of supply and significant negotiating leverage. Both are part of the Austin housing market, but they are operating under completely different conditions.
For sellers, the data delivers a clear message: location and pricing discipline matter more than they have in years. In the 26 zip codes with less than 4.9 months of inventory, well-priced homes are still moving. In the 27 zip codes above 7 months, the change needed to reach even neutral conditions averages 20% to 50% fewer active listings. That gap does not close quickly. Buyers who understand the zip-code-level data are positioned to negotiate effectively in the majority of the Austin market — and to act decisively in the pockets where supply remains tight.
Frequently Asked Questions About the Austin Real Estate Market
What does months of inventory mean in Austin real estate?
Months of inventory is a measure of how long it would take to sell all currently active listings at the current sales pace, assuming no new listings enter the market. It is one of the most widely used indicators of market balance in Austin real estate analysis. Less than 5 months generally indicates a sellers market where demand exceeds supply, 5 to 6.9 months is considered neutral or balanced, and 7 or more months signals a buyers market where supply exceeds demand. As of March 27, 2026, the median months of inventory across 75 Central Texas zip codes is 6.07, placing the overall Austin market just above the neutral threshold, though individual zip codes range from 1.62 months to 11 months.
Is Austin a buyers market or sellers market in 2026?
The answer depends heavily on which zip code you are looking at. As of March 27, 2026, 27 zip codes in the Austin area qualify as buyers markets with more than 7 months of inventory, compared to 26 zip codes in sellers market territory with less than 4.9 months. At the market-wide level, the median inventory of 6.07 months and average of 6.48 months places the Austin housing market near the neutral line, leaning slightly toward buyers. Fifty-two percent of tracked zip codes carry more than 6 months of supply. Broad statements about Austin real estate trends can be misleading — the market is highly fragmented by price point and geography.
Which Austin zip codes have the most inventory right now?
As of March 27, 2026, ten zip codes have hit the dataset ceiling of 11 months of inventory: 78701 (Downtown Austin), 78705 (UT area), 78741, Lago Vista (78645), Spicewood (78669), Driftwood (78619), Smithville (78957), Burnet (78611), Marble Falls (78654), and Dale (78616). Other heavily oversupplied zip codes include Wimberley at 10.71 months, 78721 at 10.50 months, and 78734 at 9.99 months. These zip codes are concentrated in two geographic clusters: the urban core of Austin, particularly higher-priced areas, and the Hill Country and outer ring communities where luxury and vacation-adjacent inventory has accumulated. In these markets, buyers have substantial negotiating leverage and sellers face intense competition.
Which Austin zip codes are still in a sellers market?
The tightest markets in the Austin area as of March 2026 are concentrated in the suburban north and northwest corridors. Zip code 78728 leads with just 1.62 months of inventory, followed by 78739 at 1.91 months, 78749 at 2.43 months, 78750 at 2.66 months, and 78736 at 2.71 months. Cedar Park (78613) at 3.87 months and Round Rock (78665) at 3.73 months are among the most competitive larger suburban markets. These zip codes share common characteristics: median prices generally in the $400,000 to $560,000 range, relatively fast days on market, and limited active listing counts compared to demand. Buyers competing in these Austin housing markets should expect less negotiating room and faster decision timelines.
Why are so many Austin listings having price reductions in 2026?
The volume of price reductions across Austin real estate in 2026 reflects the cumulative effect of elevated inventory and sustained mortgage rate pressure on buyer demand. Of the 14,881 active listings tracked as of March 27, 2026, 46.56% — nearly half — have already had a price reduction, with an average cut of $58,000 or about 7.04% off the original list price. This is the market's natural correction mechanism: sellers who listed at optimistic prices are adjusting to the realities of buyer purchasing power and competition from other listings. The data also shows that only 2.46% of listings have seen price increases, confirming that upward pricing momentum is limited to a very small segment of the Austin property market. Zip codes with high months of inventory tend to have the highest rates of price reduction.