Austin Area Housing Market Trends: Inventory Changes from January to March 2025
Published | Posted by Dan Price
Austin Area Housing Market Shifts: Inventory Changes from January to March 2025
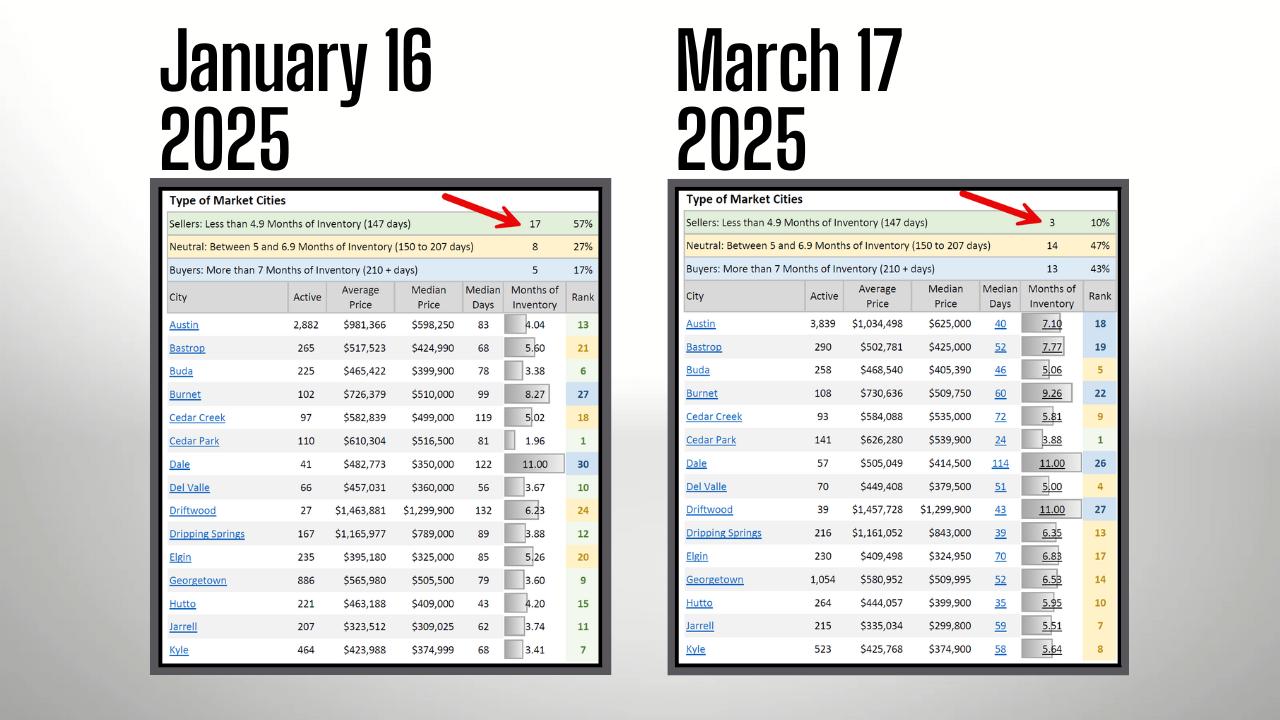
The housing market in the Austin Area has undergone some striking changes in early 2025, especially when it comes to how long homes are staying on the market. By digging into data from January 16, 2025, and March 17, 2025, we can track how inventory levels—measured in months—have shifted across 30 key cities in the region. This information, pulled together by Team Price Real Estate, shows the number of months it would take to sell all active listings if no new homes hit the market. Cities with less than 4.9 months of inventory are labeled sellers’ markets, those with 5 to 6.9 months are neutral, and anything over 7 months points to a buyers’ market. Let’s take a closer look at what’s happening in places like Austin, Marble Falls, and Cedar Park based on this detailed breakdown.
In January 2025, the Austin Area market was tilted toward sellers, with 17 of the 30 cities (57%) showing less than 4.9 months of inventory. Just 5 cities (17%) had over 7 months, indicating a buyers’ market, while 8 cities (27%) fell into the neutral range of 5 to 6.9 months. The median inventory across all cities was 4.48 months, and the average was 5.09 months, reflecting a market where homes sold fairly quickly. By March 17, 2025, things had flipped. Only 3 cities (10%) stayed in the sellers’ market range, while 14 cities (47%) were neutral, and 13 cities (43%) moved into buyers’ territory with over 7 months of inventory. The median climbed to 6.61 months, and the average hit 7.41 months, suggesting a noticeable slowdown in home sales throughout the Austin Area.
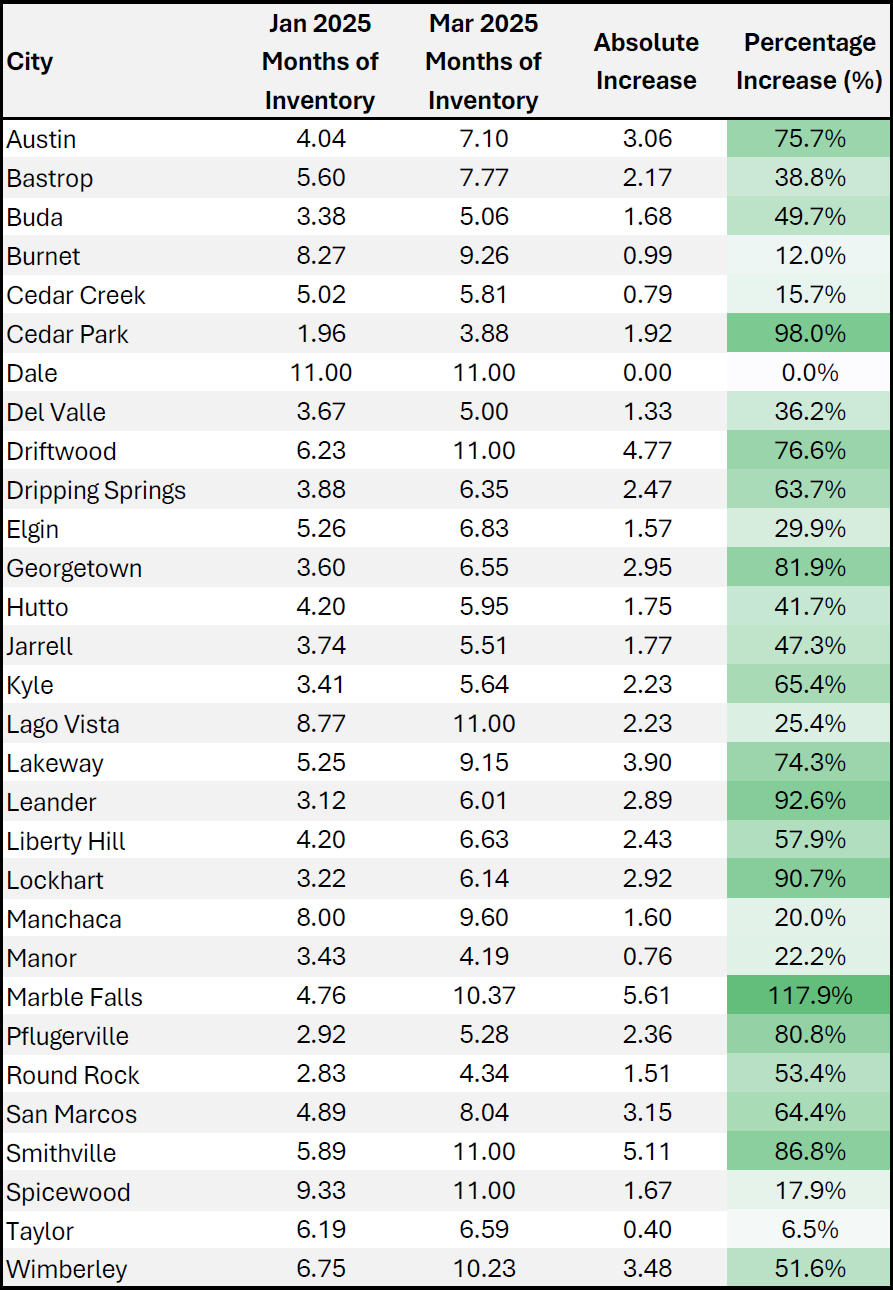
Certain cities saw dramatic inventory jumps over these two months. Marble Falls, for example, watched its months of inventory rise from 4.76 in January to 10.37 in March—a 5.61-month increase. That’s a 117.86% surge, pushing it from a sellers’ market to a solid buyers’ market. Cedar Park’s inventory went from 1.96 months to 3.88 months, up 1.92 months or 97.96%. It’s still a sellers’ market but getting closer to neutral. Leander’s inventory grew from 3.12 months to 6.01 months, a 2.89-month rise or 92.63%, shifting it from sellers’ to neutral territory. Lockhart increased from 3.22 months to 6.14 months, a 2.92-month gain or 90.68%, also landing in the neutral zone. Smithville wrapped up the top five, with inventory climbing from 5.89 months to 11.00 months—a 5.11-month jump or 86.76%—making it a strong buyers’ market by March.
Other Austin Area cities showed big changes too. Austin itself moved from 4.04 months of inventory in January to 7.10 months in March, a 3.06-month increase or 75.74%. This change took the city from a sellers’ market to a buyers’ market, with active listings growing from 2,882 to 3,839. Georgetown’s inventory rose from 3.60 months to 6.55 months, up 2.95 months or 81.94%, placing it in neutral territory. Driftwood saw a hefty increase, going from 6.23 months to 11.00 months (a 4.77-month rise or 76.57%), firmly favoring buyers. San Marcos jumped from 4.89 months to 8.04 months, a 3.15-month gain or 64.42%, also leaning toward buyers by March. Lakeway’s inventory increased from 5.25 months to 9.15 months, up 3.90 months or 74.29%, crossing into buyers’ market status.
Not all shifts were huge, but the trend toward more inventory is unmistakable across the Austin Area. Kyle’s months of inventory went from 3.41 to 5.64, a 2.23-month increase or 65.40%, moving from sellers’ to neutral ground. Pflugerville’s inventory rose from 2.92 months to 5.28 months, up 2.36 months or 80.82%, hitting the neutral range. Round Rock, still a sellers’ market, saw inventory grow from 2.83 months to 4.34 months, a 1.51-month rise or 53.36%. Wimberley’s inventory increased from 6.75 months to 10.23 months, a 3.48-month jump or 51.56%, solidifying its buyers’ market position. Even cities with smaller percentage changes, like Taylor (6.19 to 6.59 months, up 0.40 months or 6.46%), show a market cooling off since January.
The numbers also tie into active listings across the Austin Area. In January, 22 cities (73%) had less than 6 months of inventory, but by March, that dropped to 10 cities (33%). Meanwhile, cities with over 6 months of inventory rose from 8 (27%) in January to 20 (67%) in March. Liberty Hill, for instance, saw inventory increase from 4.20 months to 6.63 months, a 2.43-month rise or 57.86%, with active listings climbing from 337 to 418. Hutto’s inventory grew from 4.20 months to 5.95 months, up 1.75 months or 41.67%, with listings rising from 221 to 264. These figures reveal how supply is outpacing sales in many parts of the region.
Smaller Austin Area towns felt the shift too. Bastrop’s inventory went from 5.60 months to 7.77 months, a 2.17-month increase or 38.75%, tipping into a buyers’ market. Manchaca, starting at 8.00 months in January, rose to 9.60 months by March, up 1.60 months or 20.00%. Spicewood reached 11.00 months in March, up from 9.33 months in January (a 1.67-month gain or 17.90%). Burnet, with a smaller change, saw inventory creep from 8.27 months to 9.26 months, a 0.99-month rise or 11.97%. These numbers paint a picture of a region where homes are lingering longer, giving buyers more breathing room.
So, what’s the takeaway for the Austin Area housing market in early 2025? The data shows a clear move from a fast-moving, seller-friendly market in January to a slower, more balanced one by March. Cities like Marble Falls, Cedar Park, and Leander top the list with some of the largest percentage increases in inventory, while Austin and Georgetown show steady supply growth. Whether it’s a busy urban center or a quieter suburb, the numbers tell a story of change, with 43% of cities favoring buyers by mid-March compared to just 17% two months earlier. For anyone keeping an eye on Austin Area real estate trends, this data offers a solid look at how inventory dynamics evolved over this short but revealing stretch.
Q1: How is the housing market trending in the Austin Area in 2025?
A: In early 2025, the Austin Area housing market moved from a seller-heavy scene to a more balanced one. Team Price Real Estate data shows that in January, 57% of 30 tracked cities had less than 4.9 months of inventory, favoring sellers. By March, only 10% stayed in that range, while 43% had over 7 months, favoring buyers, and 47% were neutral (5–6.9 months). The median inventory rose from 4.48 months to 6.61 months, signaling homes are selling more slowly across the area.
Q2: Which Austin Area cities saw the biggest inventory increases in 2025?
A: From January to March 2025, Marble Falls topped the list with a 117.86% increase in months of inventory (4.76 to 10.37), followed by Cedar Park at 97.96% (1.96 to 3.88), Leander at 92.63% (3.12 to 6.01), Lockhart at 90.68% (3.22 to 6.14), and Smithville at 86.76% (5.89 to 11.00). These shifts, sourced from Team Price Real Estate, show a clear trend toward higher supply in these markets.
Q3: What does an increase in months of inventory mean for Austin Area homebuyers?
A: An increase in months of inventory, like the Austin Area’s jump from 5.09 to 7.41 between January and March 2025, means more homes are available compared to demand. With 20 of 30 cities exceeding 6 months by March (up from 8 in January), buyers gain more options and bargaining power, while sellers may see listings sit longer. This data, tracked by Team Price Real Estate, points to a cooling market favoring buyers.