Austin’s housing market broke one of its most predictable seasonal patterns this fall. For the first time in years, October saw an increase in market velocity instead of the usual cooldown. The Activity Index, which tracks the percentage of listings under contract, rose from 18.6 percent in September to 19.4 percent in October. That 4.3 percent month-over-month increase might seem modest, but it carries real significance. October typically marks the beginning of the seasonal slowdown, yet this year Austin’s market showed a faint but notable sign of recovery.
Understanding the Activity Index
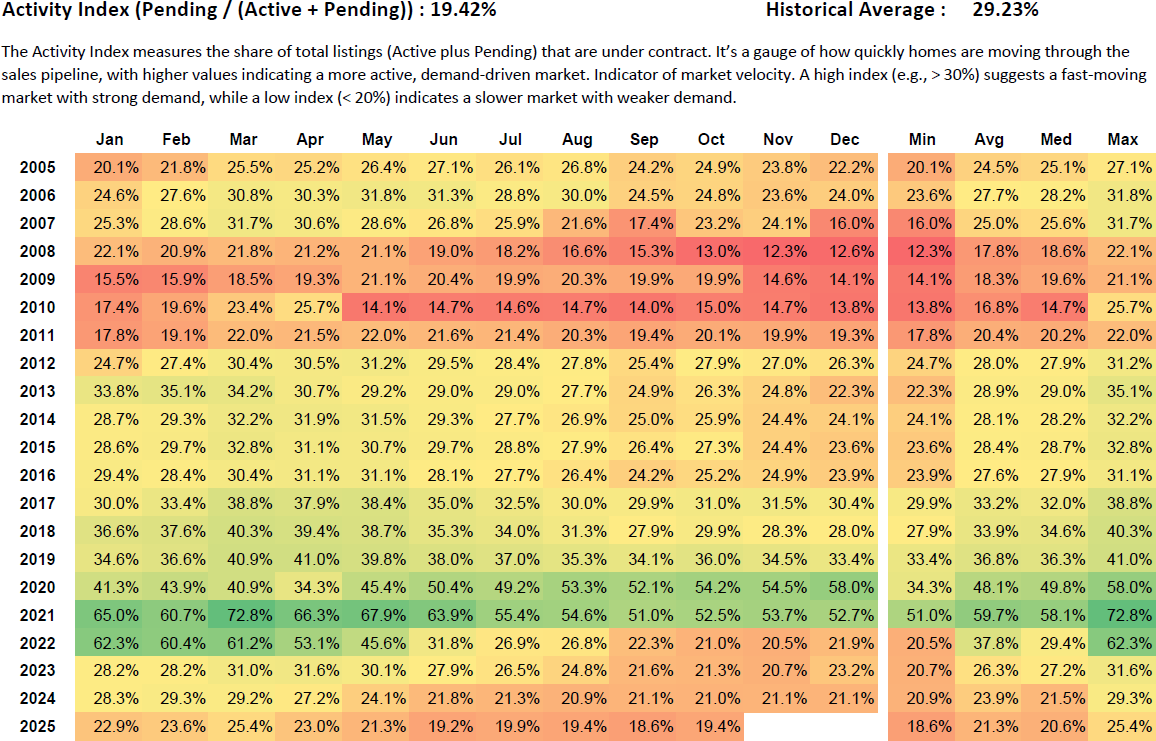
The Activity Index measures the share of total listings that are under contract, calculated using the formula: Pending ÷ (Active + Pending)
This figure represents how quickly homes are being absorbed by buyers compared to the total available inventory. It is essentially a gauge of market velocity. A higher index reflects stronger demand and faster turnover, while a lower index signals slower absorption and weaker buyer activity.
When the Activity Index exceeds 30 percent, the market is typically fast-moving, competitive, and demand-driven. When the index drops below 20 percent, it indicates that homes are taking longer to sell and buyers have more leverage. The index allows analysts and agents to see where the market sits within the supply-demand cycle at any given time.
Austin’s historical average Activity Index is 29.23 percent, which represents balanced and healthy absorption. The current reading of 19.4 percent remains below that benchmark, yet the direction of movement is what matters most. After several months of decline, the October improvement signals a potential inflection point where demand is stabilizing and beginning to reengage.
Breaking the Seasonal Pattern
From 2005 through 2024, Austin’s Activity Index has almost always declined between September and October. The fall months usually bring fewer active buyers, longer listing times, and slower absorption rates. On average, the index has dropped by about one point between those two months.
In 2025, that pattern reversed. Instead of losing momentum, Austin’s index climbed by 0.8 points, a 4.3 percent gain. This makes October 2025 one of the rare instances in the past two decades where market activity increased as the year moved into the slower season.
This reversal suggests the market may have reached a short-term bottom. Buyers who had been waiting on the sidelines are starting to step in, particularly at lower price points where affordability has improved. Inventory growth has also slowed, allowing pending sales to catch up slightly. While a 19.4 percent index still represents weak absorption, the change in direction carries weight for what might follow in early 2026.
Where the Market Stands
Analysts often use general Activity Index ranges to interpret overall conditions. When the index is above 30 percent, the market is considered to be in Expansion, defined by strong demand and rising prices. Between 25 and 30 percent, the market is in Equilibrium, reflecting balance between buyers and sellers. Between 20 and 25 percent, the market enters the Softening phase, where sales slow and inventory begins to rise. Between 15 and 20 percent, the market is in Contraction, showing supply imbalances and mild price declines. Below 15 percent, the market enters Crisis conditions, where buyers pause and price corrections accelerate.
At 19.4 percent, Austin remains in the Contraction range but is nearing the Softening threshold. This means conditions are still tilted toward buyers, yet slightly more stable than in recent months. If the Activity Index can move above 20 percent and hold through the winter, it will signal that the market has transitioned out of contraction and into early recovery.
Historical Perspective
When viewed through a historical lens, October 2025 still represents a slow market, but one showing early signs of momentum. The last time Austin recorded a meaningful October increase was in 2018, when the market was much stronger overall. The context this time is entirely different, with higher mortgage rates, greater supply, and more affordability constraints.
For perspective, October 2023 recorded an Activity Index of 21.7 percent, while October 2024 came in at 21.0 percent. Both years saw typical fall slowdowns. In contrast, this year’s rise from 18.6 to 19.4 percent, although modest, breaks the downtrend and may represent the first improvement in market velocity since early 2024.
Why Activity Improved
Several contributing factors explain why Austin’s Activity Index improved in October.
First, price adjustments across much of the market have brought values closer to what buyers can afford. Median sold prices are roughly 20 percent lower than the 2022 peak, which has helped revive interest among price-sensitive buyers.
Second, fewer new listings entered the market. As potential sellers continue to hold onto low-rate mortgages, fewer homes are being added to inventory. That reduced supply helps stabilize absorption rates even when buyer demand remains tepid.
Third, temporary mortgage rate dips in October gave buyers incentive to act before rates moved back up. These short-term drops often cause a burst of contract activity that shows up in the month’s data.
Lastly, seasonal listing holdbacks have reduced overall supply. Many homeowners who planned to sell this fall chose to wait until spring, leaving the market with less new inventory to offset sales. That slowdown in new supply helped boost the share of pending homes relative to active listings.
What It Means for Buyers
For buyers, this improvement signals that the best opportunities may still be available but competition for well-priced homes is slightly firmer. The Austin housing market remains negotiable, yet homes that are updated, move-in ready, and priced near the median are starting to attract multiple offers again. Buyers who have been waiting for a bottom should recognize that activity, while still low, is no longer deteriorating.
What It Means for Sellers
For sellers, October’s data serves as a reminder that demand still exists when pricing aligns with the market. Homes priced correctly relative to recent comparable sales are being absorbed at a faster pace. Listings that remain above market value continue to stagnate. The key takeaway is that sellers must stay responsive to market data rather than relying on outdated pricing expectations from prior years.
What It Means for Investors
Investors should view this shift as an early indicator of improving liquidity. While overall absorption remains slow, the first uptick in activity after months of decline suggests that downside risk may be narrowing. Rental markets remain stable, and yields continue to improve as prices remain soft. Investors focused on long-term buy-and-hold strategies will find more attractive entry points now than during the height of the boom.
Outlook for the Coming Months
The coming months will determine whether this improvement represents a temporary fluctuation or the start of stabilization. Historically, winter months bring lower activity levels, but this fall’s increase may suggest a shift in trend. If the Activity Index continues to rise and holds above 20 percent through early 2026, it would indicate the market has moved out of contraction and into a softening or early equilibrium phase.
Momentum will be the critical factor. The fact that Austin’s Activity Index increased in October, a month that typically shows decline, points to growing stability after a prolonged cooling period.
FAQ
1. What is the Activity Index in real estate?
The Activity Index measures the share of total listings that are under contract, using the formula Pending ÷ (Active + Pending). It tracks how quickly homes move through the sales process and serves as a key indicator of market velocity. A higher index indicates stronger absorption and faster sales, while a lower index reflects slower turnover and weaker demand.
2. Why did Austin’s Activity Index rise in October 2025?
The index increased from 18.6 percent to 19.4 percent as fewer new listings entered the market, prices adjusted closer to buyer expectations, and short-term interest rate dips encouraged more contracts. The combination of fewer new listings and slightly more buyers resulted in a higher percentage of homes going under contract.
3. What does a 19.4 percent Activity Index mean for Austin’s housing market?
It indicates that Austin remains in a contraction phase, where inventory exceeds buyer demand, but conditions are improving. The market has not recovered yet but is showing early signs of stabilization.
4. How does Austin’s current Activity Index compare to its long-term average?
The long-term average is 29.23 percent, which represents a balanced market. The current 19.4 percent remains below that level but shows improvement from September’s 18.6 percent, suggesting that the market is slowly gaining traction.
5. What can buyers and sellers expect heading into 2026?
If the Activity Index continues rising and crosses 20 percent early in 2026, it will mark a move from contraction into softening. Buyers can expect slightly more competition, and sellers may see improved showing activity for well-priced listings.