Austin Real Estate Market: Hyperlocal Inventory Analysis by ZIP Code and Price Range
Published | Posted by Dan Price
Austin Real Estate Market Update: Inventory Gaps Expose a Hyperlocal Market Shift
Austin’s housing market cannot be explained by a single number. The citywide average of 5.5 months of inventory only tells part of the story. Beneath that headline figure, the data reveals dozens of micro-markets behaving very differently from one another. Inventory levels vary dramatically from one ZIP code to the next, and even more within individual price brackets. This uneven landscape is defining the new phase of the Austin housing market—one where localized analysis now determines strategy and success.
At a macro level, 5.5 months of inventory suggests a market that has moved into balance, leaning slightly toward buyers. But averages hide volatility. Across Austin’s 75 ZIP codes, inventory ranges from under three months in high-demand areas to over a year in slower-moving submarkets. When you layer in price segmentation, those differences widen further. Some price tiers are still competitive, while others are flooded with supply.
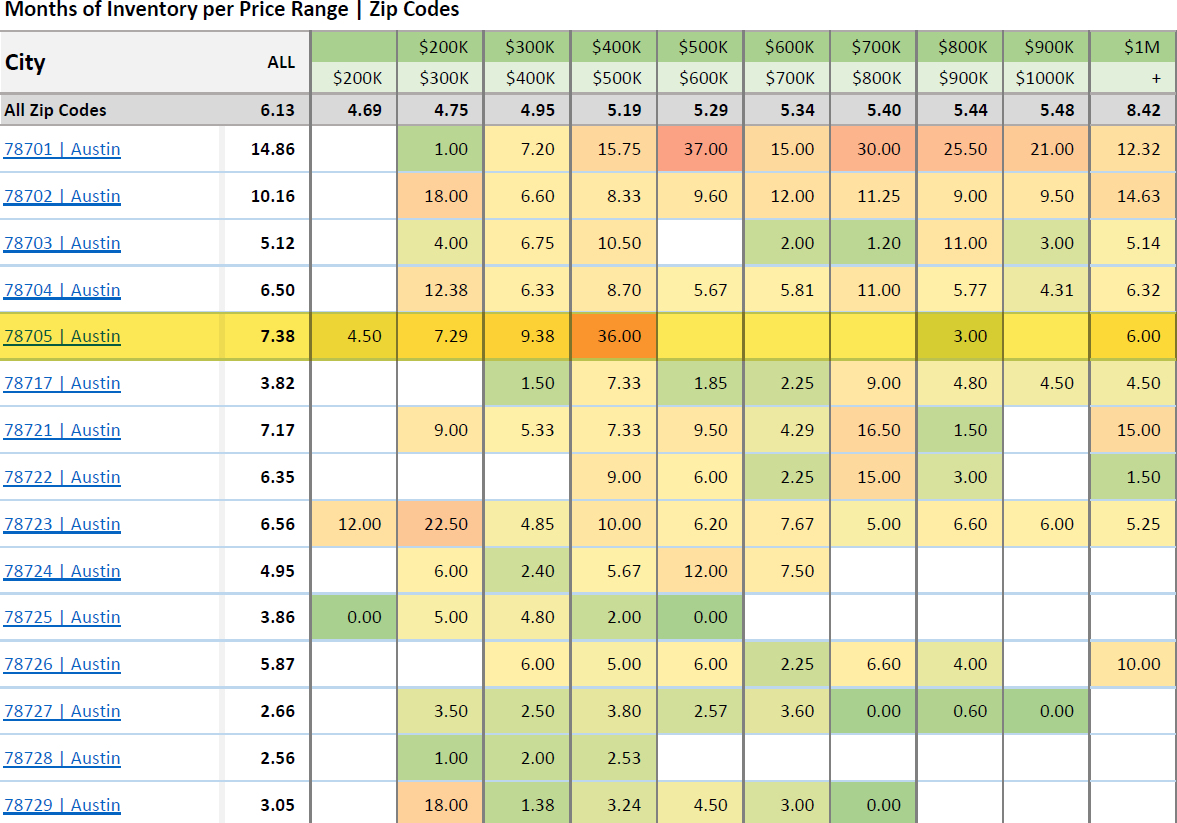
Take 78705, a ZIP code in Central Austin known for its mix of student housing, rentals, and small multifamily properties. On paper, it shows an overall inventory of 7.38 months, but that figure is just an average of extremes. In the $400,000 to $500,000 range, inventory stretches to a staggering 36 months, indicating that homes at this price point are barely moving. By contrast, homes in the $800,000 to $900,000 range show only three months of supply, a pace consistent with a seller-tilted environment. The same neighborhood is simultaneously in both buyer control and seller control, depending on price point.
This disparity demonstrates the core reality of the Austin real estate market: averages are deceiving. A property that looks well-positioned on paper might actually be overpriced for its ZIP code and price band once the hyperlocal data is applied. The difference between a three-month and thirty-six-month supply is not academic—it determines whether a listing gets multiple showings or sits idle for half a year.
Across other central ZIP codes, similar contrasts emerge. In 78704, which includes South Congress and Zilker, the overall inventory sits around 6.5 months, reflecting balance. Yet within that, $300K properties show only 12 months of supply, while $800K listings hover near 11 months, and those above $1M average just over six months. In 78702, once one of Austin’s hottest redevelopment corridors, homes under $400K are in short supply, but those between $400K and $700K have reached double-digit months of inventory. That pattern—lower price tiers constrained, mid-tier oversupplied—is visible across much of the Austin property market.
For agents, buyers, and sellers alike, this is where analytical precision matters most. When market conditions diverge this widely within a few blocks, understanding the months of inventory by ZIP code and price point becomes essential for setting expectations. Sellers must know whether they are in a three-month or twelve-month environment before pricing their home. Buyers must identify which brackets favor them most, where their offers carry the greatest weight. And investors, especially those seeking rental conversion or resale opportunities, must analyze where absorption is tightening or where supply is piling up.
The entire Austin housing market is recalibrating around this new complexity. Broad market reports that once served as useful guides now fail to capture the nuance required for real-time decision-making. The city has entered a phase of hyperlocal equilibrium, where every ZIP code and price segment forms its own cycle within the larger market.
From an analytical perspective, months of inventory is one of the most accurate indicators of market balance. It measures how long it would take for all active listings to sell at the current pace of demand. The traditional rule of thumb remains true: less than four months signals a seller’s market, four to six months indicates balance, and above six months reflects a buyer’s advantage. What is new is how sharply these zones now shift by location and price. For example, 78729 in Northwest Austin shows only 3.86 months of inventory overall, suggesting strong absorption, while nearby 78702 sits above 10 months. The difference between these two markets reflects different buyer pools, product types, and pricing psychology—all under the same regional umbrella.
This pattern extends throughout the metro area. Peripheral markets like Manor, Elgin, and Liberty Hill have seen inventory rise into the seven- to nine-month range, creating clear buyer leverage. In contrast, established inner-core neighborhoods near job centers and major amenities maintain near-equilibrium levels. When new construction enters those outlying areas at scale, it adds even more pressure to resale listings that cannot compete on incentives or energy efficiency.
This is why analyzing inventory across both ZIP codes and price points is the cornerstone of understanding the modern Austin housing market. The citywide average paints a picture of moderation, but in reality, there are multiple markets operating simultaneously. Some are balanced, others softening, and a few pockets remain heated. For professionals interpreting today’s data, the takeaway is clear: the Austin real estate market is no longer uniform. It is segmented, stratified, and evolving in real time.
As the market continues to normalize, this segmentation will deepen. Buyers will become more targeted, builders more selective, and sellers more analytical in pricing. The key to success lies in shifting from macro assumptions to micro precision. Every ZIP code and every price tier tells a different story, and understanding that difference is now the defining skill in Austin real estate analysis.
FAQ Section
1. What does “5.5 months of inventory” really mean in the Austin real estate market?
It means that if no new listings were added, it would take about five and a half months to sell all existing homes at the current pace of demand. While this sounds balanced, the figure is only an average. Certain ZIP codes and price brackets are far above or below that level, creating localized buyer and seller markets across the city.
2. Why does inventory vary so much between ZIP codes in Austin?
Inventory differences are driven by local demand, price sensitivity, and new construction patterns. Areas near job centers and downtown amenities, like 78701 or 78704, maintain lower supply and faster absorption. Outlying ZIPs, such as 78702 or 78705, have seen inventory spike in mid-tier price ranges due to affordability limits and increased new listings.
3. How does price point affect inventory levels in Austin?
Price point now dictates market speed more than almost any other factor. Entry-level homes under $400,000 often move faster, while the $400,000–$700,000 tier carries the heaviest supply in many ZIP codes. Luxury segments over $1 million show moderate balance, supported by stronger buyer qualification and less turnover.
4. What does it mean when a ZIP code has 36 months of inventory?
That is a severe oversupply. It means homes in that price range are selling so slowly that it would take three years to clear current listings. In practice, that points to either overpricing, lack of demand, or mismatch between what buyers want and what is being offered. In 78705, for example, the $400K–$500K bracket fits this description.
5. How can agents and investors use hyperlocal inventory data effectively?
By focusing on months of inventory by ZIP and price tier, professionals can identify where to buy, sell, or hold. Agents can adjust pricing strategies to match actual absorption rates, investors can target neighborhoods with tightening supply, and buyers can negotiate more confidently in markets with excess inventory.