2025 Housing Market Update: National Stats and Austin Data Breakdown
Published | Posted by Dan Price
A Deep Dive into the U.S. and Austin Housing Markets in March 2025
The housing market across the United States in March 2025 reveals a sluggish yet shifting landscape, with nationwide data indicating distress and regional variations highlighting stark differences. Zooming into Austin, Texas, detailed local data from Team Price Real Estate provides a granular look at how this key metro area aligns—or diverges—from national trends. By weaving together national statistics with Austin-specific figures, we can better understand the housing market dynamics as of March 4, 2025.
Nationally, the median sales price for homes stands at $377,000, reflecting a 4% increase year-over-year based on a four-week rolling average. This uptick masks a growing divide: upper-end homes are driving much of the growth, while lower-end properties lag behind. Active listings nationwide have climbed to 976,659, up 9.68% from last year, marking a four-year high. However, this growth is slow, and reaching the 1 million mark could signal a healthier market. In Austin, inventory trends align, with active residential listings reaching 12,193 on March 4, 2025—a 16.9% jump from 10,428 in 2024. This increase suggests more homes are available, though it remains below the previous high of 15,503 seen on July 15, 2024, indicating a cautious buildup rather than a flood of supply.
Days on market (DOM) nationally averages 56.2 days, up 7.5 days from last year—another four-year high. This longer time on the market points to homes sitting unsold, often leading to price reductions. In Austin, the median DOM across various zip codes varies widely, averaging around 50 days in central areas like 78701 and climbing to 115 days in outlying zones like 78612 (Cedar Creek). Local data supports the national observation that properties are taking longer to sell, with 35.5% to 62.5% of homes in Austin zip codes lingering 100 days or more, depending on the area.
Price cuts are a critical measure nationally, with 6% of listings seeing reductions—an increase of 1.2% year-over-year and a four-year peak. This trend surpasses typical seasonal patterns and hints at seller urgency. Austin mirrors this, with 42.6% of active listings citywide experiencing price drops as of March 4, 2025. In specific zip codes, like 78747, that figure spikes to 57%, while in 78757, it’s lower at 34.9%. These reductions reflect sellers cashing in equity or struggling to maintain ownership amid high costs, aligning with national patterns.
New listings nationwide stand at 81,500, up 2.4% from last year, though still historically low compared to pre-pandemic levels. Zillow estimates that 78% of these listings come from distressed sellers, a figure that could foreshadow a crash if new listings surge. Austin’s new construction segment, comprising 30.5% of active listings (3,719 homes), shows similar distress, with 56% of new homes in zip code 78628 (Georgetown) seeing price drops. Resale properties dominate at 69.5% (8,474 homes), with an average list price of $766,470, reflecting a robust but softening market.
Pending sales nationally have dropped to 73,400—a 6.2% decline year-over-year—indicating a deeply depressed transaction volume. In Austin, pending listings stand at 4,062 on March 4, 2025, down 8.7% from 4,449 in 2024, reinforcing the national slowdown. The activity index—a measure of pending sales relative to total listings—sits at 25.0% in Austin, down 16.4% from 29.9% last year, further highlighting a cooling market.
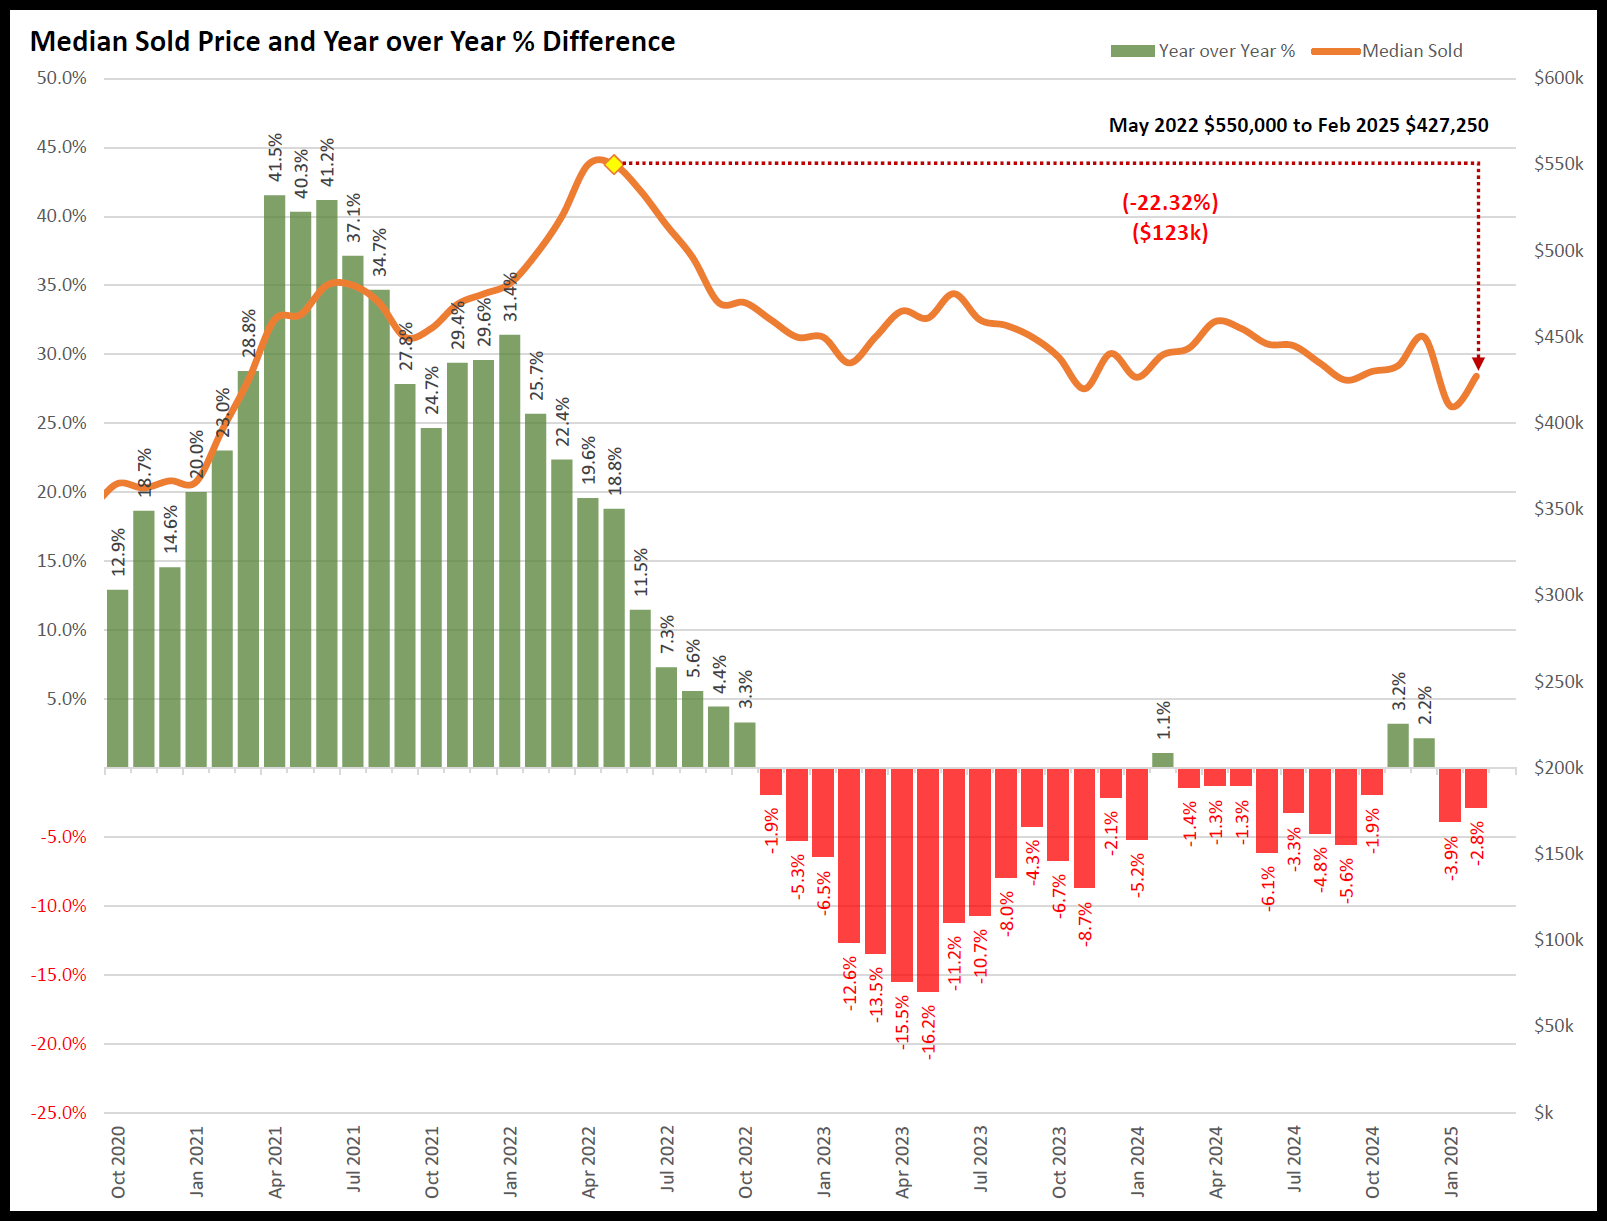
Mortgage interest rates, a major driver of affordability, are at 6.78% for a 30-year conventional loan nationwide, the lowest since November 2024. This rate tracks the 10-year Treasury yield, impacting affordability. For a $377,000 loan, the monthly payment is $2,452 (excluding taxes and insurance). In Austin, the median sold price was $427,250 in February 2025, down 2.8% year-over-year, suggesting that even with lower rates, high prices continue to strain buyers.
Austin stands out as the worst-performing market nationally, with a peak price of $574,000 in April 2022 dropping to $429,000 by March 2025—a 25.2% decline. Local data shows 641 homes sold in February 2025, a 16% year-over-year drop from 765. In contrast, Milwaukee, the top performer, boasts an 11% price increase to $311,000. Austin’s months of inventory now stand at 4.28 (up 17.9% from 3.63 in 2024), indicating a market tilting toward buyers but not yet balanced. Our data on the Median Sold Price from Peak displays a slightly different number but still down significantly.
Nationally, a bifurcated market emerges where top regions thrive on low inventory while bottom ones, like Austin, face steep declines. Zillow’s 78% distressed seller statistic underscores underlying stress, though new listings haven’t spiked yet. In Austin, special listing conditions like short sales (0.36% of active listings) and pre-foreclosures (0.10%) remain minimal but signal pockets of financial strain. The trajectory of price cuts and DOM suggests growing seller distress, potentially setting the stage for broader price drops if inventory accelerates.
Market conditions nationwide show prolonged DOM, rising price cuts, and low transaction volume, with inventory growing but not fast enough to shift dynamics significantly. Austin reflects this, with sales declining across most zip codes—down 53% in 78748 and 51% in 78744—while a few, like 78725 (up 125%), buck the trend. Prices remain elevated nationally at $377,000 and locally at $429,000, but high interest rates and softening demand make renting cheaper than owning in many cases.
For buyers, using data over emotions is key, focusing on subdivision analysis with comparable sales. In Austin, average sold prices range from $234,000 in foreclosure-heavy areas (like zip code 76550) to $1,193,146 for “to be built” homes. An extra $250 monthly payment on a $377,000 loan saves $138,626 in interest, offering buyers a strategy to mitigate high rates.
In summary, the U.S. housing market in March 2025 navigates a slow grind, with Austin exemplifying the challenges of a once-hot market cooling off. National data reveals a strained yet resilient system, while Austin’s numbers—12,193 active listings, 4,062 pending, and a 25.2% price drop from its peak—underscore a local market adjusting to new realities. As inventory creeps up and sales falter, both national and Austin trends suggest a pivotal moment for housing in 2025.
1. What is the current state of the U.S. housing market in 2025?
As of March 4, 2025, the median sales price is $377,000, up 4% year-over-year, with 976,659 active listings (up 9.68%) and 73,400 pending sales (down 6.2%). Homes average 56.2 days on market, and 6% of listings face price cuts, indicating a slow, distressed market.
2. How has the Austin housing market changed in 2025?
Austin’s median price dropped 25.2% from $574,000 in April 2022 to $429,000 by March 2025. Active listings hit 12,193 (up 16.9%), pending sales fell to 4,062 (down 8.7%), and 641 homes sold in February 2025 (down 16%), with 42.6% of listings seeing price cuts.
3. Are home prices going down in 2025?
Nationally, prices rose 4% to $377,000, driven by upper-end homes. In Austin, prices fell 25.2% to $429,000, with 42.6% of listings reduced. While national prices hold, regional declines like Austin’s suggest softening in specific markets.